- Ripple price snaps two-day winning streak before recovering from 100-day SMA.
- Key SMA breakout, along with strong RSI and MACD, supports bullish outlook for XRP.
- XRP/USD bulls face key test at 200-day SMA and long-term descending trendline.
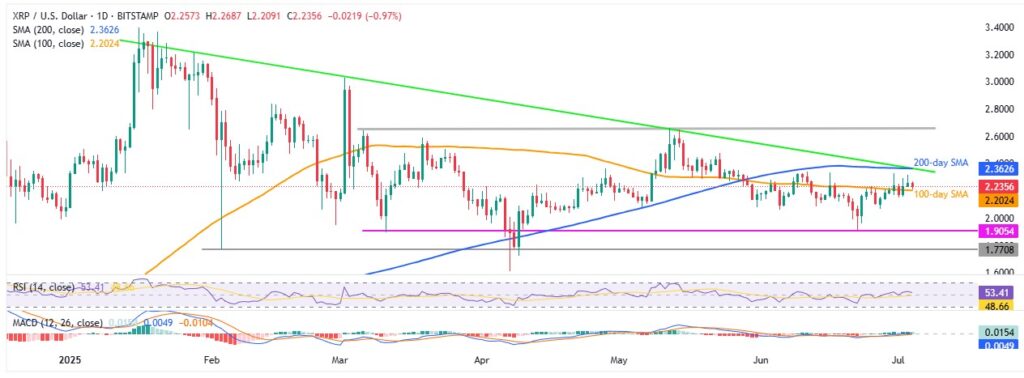
Ripple (XRP/USD) dipped slightly to around $2.2380 on Friday, ending its two-day winning streak. However, the 100-day Simple Moving Average (SMA) provided strong support, sparking a bounce back. That said, positive signals from the 14-day Relative Strength Index (RSI) and Moving Average Convergence Divergence (MACD) keep the bullish outlook intact for XRP.
XRP/USD: Daily chart favors bullish bias

Source: Tradingview
Ripple’s repeated rebounds from strong multi-month support, combined with the recent bounce off the 100-day SMA and positive momentum from the 14-day RSI and MACD, keep buyers hopeful.
However, XRP bulls face a tough challenge at the 200-day SMA and a descending resistance near $2.36. Breaking above this could push prices toward the four-month resistance zone around $2.65.
If XRP holds above $2.65, a move toward January’s yearly high of $3.40 is possible.
On the downside, a drop below the 100-day SMA support at $2.20 could open the door for sellers to target the $2.00 psychological level, with further support near $1.90 and $1.77 before bears gain full control.
XRP/USD: Four-Hour chart signals short-term trading range

Source: Tradingview
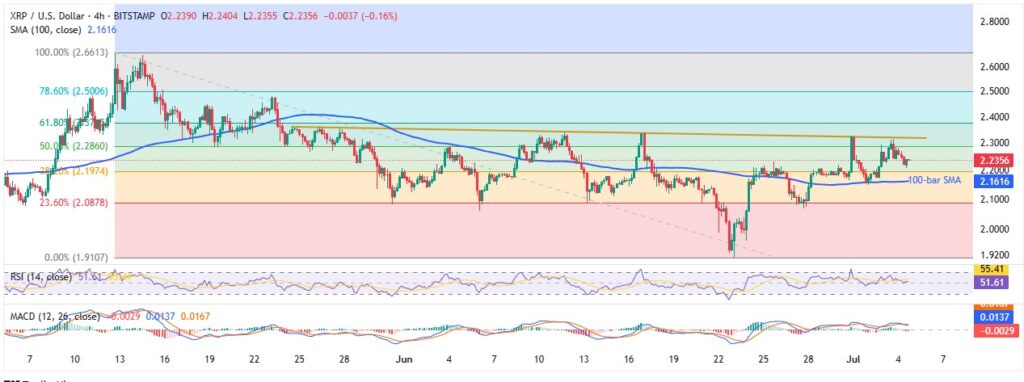
Unlike the daily chart, XRP/USD’s four-hour chart shows a short-term trading range between the 100-bar SMA near $2.16 and a six-week-old descending resistance around $2.32.
The RSI is hovering near neutral at 50, and the MACD signals are weak, suggesting the current weekly momentum may continue within this range.
Traders should also watch $2.48 and $2.07 as key levels.
Overall, XRP/USD looks positive but could see some short-term sideways movement.


