- Ripple price extends recovery from 200-day EMA, poised for biggest daily gain in five weeks.
- Bullish RSI, MACD signals point to further upside for XRP, but multi-month-old “falling wedge” appears a key test for the bulls.
- XRP/USD sellers need a confirmed break below $2.09 to regain control.
Ripple (XRP/USD) price extends its week-start run-up, marking the biggest daily gain in over a month as bulls celebrate the climb toward the $2.26 level during Monday’s U.S. session. In doing so, XRP buyers defend last week’s rebound from the 200-day Exponential Moving Average (EMA), supported by a firm 14-day Relative Strength Index (RSI) and bullish signals from the Moving Average Convergence and Divergence (MACD) indicator.
These technical indicators collectively suggest further upside for the XRP/USD pair, potentially targeting a three-week-old descending resistance line. However, a five-month-old “Falling Wedge” bullish chart pattern presents a crucial test for the bulls, likely deciding whether the pair can extend its current recovery momentum.
XRP/USD: Daily chart points to limited upside room

Source: Tradingview
Ripple (XRP/USD) buyers extend the prior week’s rebound from the 200-day EMA, bolstered by an RSI holding above 50.00 and a potential bullish crossover on the MACD. These signals support the case for continued upside toward a three-week-old descending resistance line, currently seen near $2.31.
Adding to the bullish narrative, price action since mid-January outlines a “Falling Wedge” formation — a classic bullish reversal pattern — with boundaries currently set between $2.50 and $1.43, further teasing optimistic XRP traders. Beyond that, a 14-week-old horizontal resistance zone around $2.65–$2.66 acts as another key hurdle; a breakout above this zone could trigger a swift move toward the $3.00 psychological mark.
On the flip side, sellers would need a confirmed break below the 200-day EMA support at $2.09, followed by a drop below the $2.00 round figure, to regain short-term control.
Even then, April’s low of $1.61, the wedge bottom near $1.43, and November 2024 levels around $1.27 would serve as critical downside supports that XRP bears must overcome to sustain momentum.
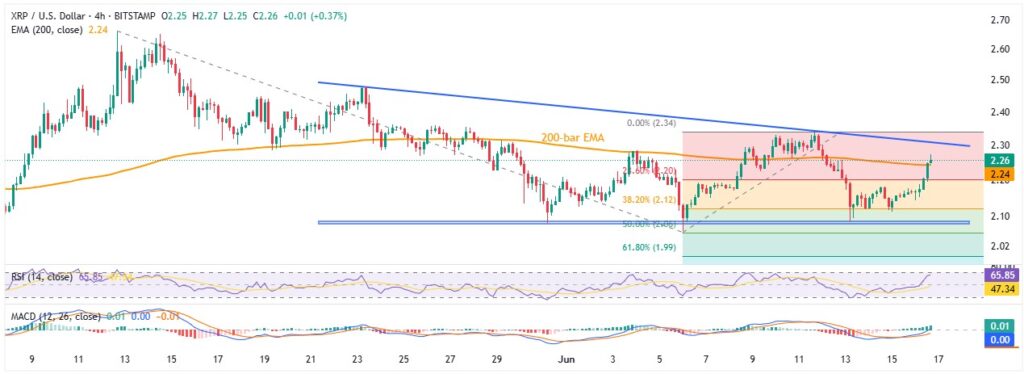
XRP/USD: Four-Hour chart highlights bullish potential

Source: Tradingview
On the four-hour chart, XRP/USD bulls have just crossed the 200-bar EMA at $2.24, moving toward the resistance line of a three-week-old bullish triangle formation, located near $2.31. However, the RSI is nearing the overbought threshold of 70.00, which may challenge further upside near this key resistance — even as the MACD remains bullish, keeping the upside bias intact.
If XRP manages to sustain a break above $2.31, attention will turn to the resistance levels outlined on the daily chart, particularly the $2.50–$2.65 zone and beyond.
On the downside, sellers will look for a decisive move below the 200-bar EMA support at $2.24 to re-enter. In that case, the lower boundary of the triangle formation, aligned with the 200-day EMA on the daily chart around $2.09, will act as a critical support zone. Additional downside filters include the 50% and 61.8% Fibonacci Extensions (FE) of the May–June rally, situated near $2.06 and $1.99, respectively.
In summary, Ripple buyers appear positioned to break out of a five-month-long bullish consolidation phase. However, a confirmed breakout from the broader “falling wedge” pattern is still required to validate expectations of a sustained advance.


