- Ripple price retreats from a week’s high, snapping three-day winning streak amid crypto market consolidation.
- Bearish momentum indicators, downside break of key EMAs keep XRP sellers optimistic.
- Nearly oversold RSI, XRP ecosystem positives highlight 11-month support line for bears.
- Broad bullish trend holds despite potential short-term weakness in Ripple prices.
Ripple (XRP) price drops 3.0% intraday to $2.42 early Tuesday morning in New York, snapping its three-day winning streak amid broad crypto market consolidation.
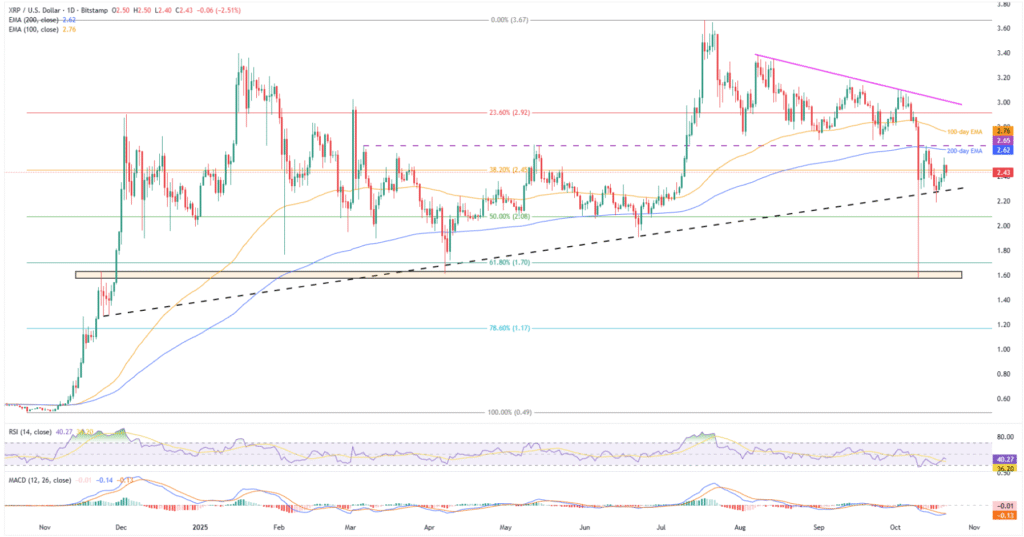
In doing so, the altcoin fades Friday’s recovery from an 11-month-old ascending support line amid bearish momentum indicators like the 14-day Relative Strength Index (RSI) and the Moving Average Convergence Divergence (MACD).
However, the XRP ecosystem’s positives and on-chain signals join nearly oversold conditions of the RSI to suggest a long and bumpy road for the bears before taking control.
On the same line, a pullback in the trading volume and market capitalization (market cap) adds strength to the doubts about Ripple’s further weakness. According to Santiment, XRP’s daily trading volume eases from a three-day high to $4.63 billion, while the market cap also faces a pullback from a week’s top to $145.19 billion.
With this, the XRP’s short-term downside appears mostly confirmed, but the broad bullish trend may hold.
Ripple Price: Daily Chart Suggests Limited Downside

Ripple’s latest weakness traces bearish MACD signals and a downbeat RSI, as well as previous breaks beneath the key Exponential Moving Averages (EMAs), to keep the short-term sellers hopeful.
However, the 14-day RSI line is near the oversold boundary of 30.00, which triggered the quote’s previous rebound, highlighting an ascending support line from November 2024, close to $2.28.
Hence, unless Ripple buyers manage to stay beyond the 100-day EMA, the XRP bears look set to approach the 50% Fibonacci retracement of October 2024 to July 2025 rally, close to $2.08, followed by February’s low of $1.77 and the 61.8% Fibonacci ratio surrounding $1.70.
However, a horizontal area comprising levels from November 2024, near $1.63-$1.58, appears to be a tough nut to crack for Ripple bears.
Following that, sellers can for a gradual south-run targeting the late 2024 bottom of $0.49, with the 78.6% Fibonacci retracement of $1.17 and the $1.00 likely acting as intermediate halts.
Alternatively, XRP rebound needs successive daily closings beyond the 200-day EMA and horizontal hurdle from March, respectively near $2.62 and $2.65, ahead of directing buyers to the 100-day EMA hurdle of $2.78.
Should XRP bulls keep reins past $2.78, a 10-week descending resistance line surrounding $3.02 will be the last line of defense for the bears.
Ripple Price: Four-Hour Chart Lures Short-Term Bears

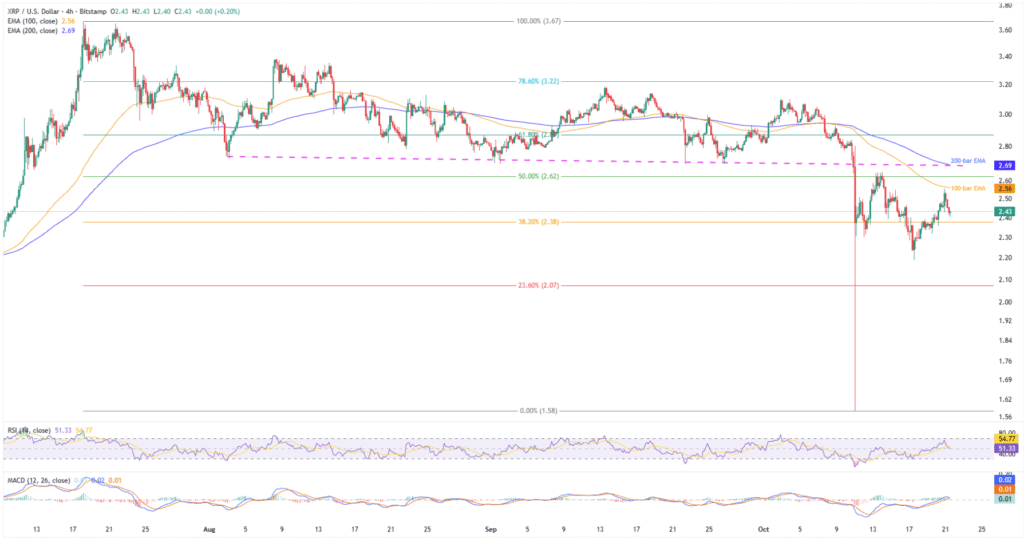
On the four-hour chart, Ripple’s XRP reverses from the 100-bar EMA, and the RSI, as well as the MACD, aren’t overheated, suggesting further room towards the south, at least for the short-term.
This signals the XRP’s further weakness toward the latest trough, Friday’s low, of around $2.19, a break of which will shift the market’s attention toward the 23.6% Fibonacci retracement of the July-October downturn, near $2.07, and the monthly low of $1.58.
On the flip side, an upside clearance of the 100-bar EMA hurdle of $2.56 isn’t an open invitation to the XRP bulls as a convergence of an 11-week resistance line and 200-bar EMA highlights $2.69 as the short-term key resistance for the bulls to cross.
Beyond that, the daily chart’s higher levels could attract buyers while restoring the upside expectations.
Conclusion
Ripple’s short-term downside is gaining momentum, highlighting key support levels discussed on the daily chart. However, a daily close above $2.69 resistance could trigger XRP’s strong recovery. That said, the altcoin’s short-term declines are possible, but the overall quarterly and yearly bullish trend is likely to remain intact.
Also read: Is XRP Ready to Rebound? Here’s What On-Chain Data Says


