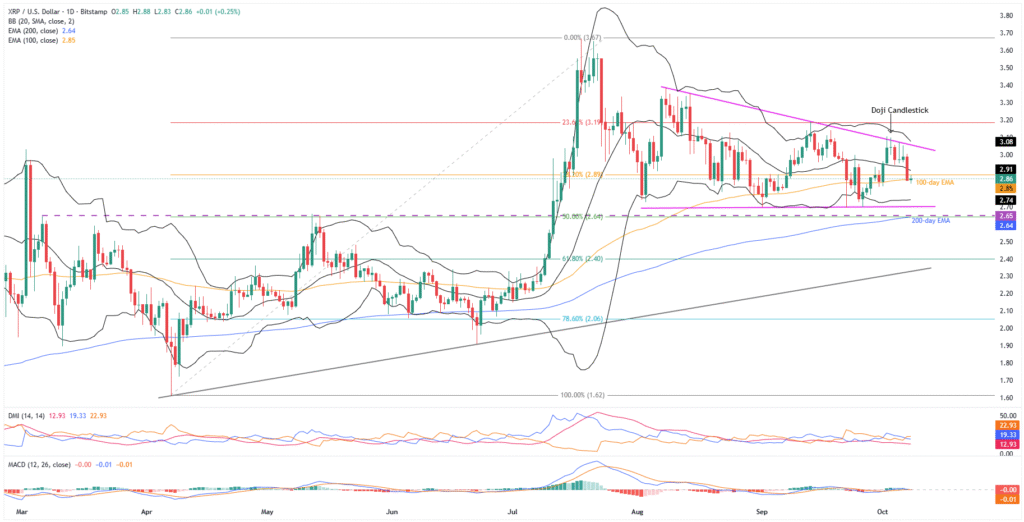
- Ripple price hovers at weekly low, following the biggest daily slump in a fortnight.
- 100-day EMA restricts XRP’s immediate downside within a two-month triangle.
- Bearish MACD and DMI signals hint at further declines for Ripple, testing the bullish triangle setup.
- The $2.65-$2.64 support zone is holding strong for XRP; a breakdown could threaten its quarterly gains.
- Broad bullish trend holds despite potential short-term consolidation in Ripple prices.
Ripple (XRP) price remains sidelined around $2.86 early Wednesday, after hitting a weekly low, as the 100-day Exponential Moving Average (EMA) challenges sellers following the biggest daily slump in two weeks.
That said, the crypto market’s consolidation ahead of the Federal Open Market Committee (FOMC) Meeting Minutes, coupled with bearish signals from the Moving Average Convergence Divergence (MACD) and Directional Movement Index (DMI) momentum indicators, pressures the XRP traders.
Meanwhile, strong trading volume and a bounce in the market capitalization (market cap) also test short-term Ripple traders. That said, the XRP’s daily trading volume hits a week’s high of $7.33 billion, whereas the market cap rebounds from a week’s low to $171.3 billion by press time, according to Santiment.
Notably, Binance Coin (BNB) has overtaken Ripple’s XRP to become the world’s third-largest crypto, drawing funds away from XRP and explaining its recent price drop. However, a two-month symmetrical triangle pattern and strong downside support are limiting further declines, helping to protect XRP’s overall bullish trend.
Read Details: Binance News Today: BNB Flips XRP, Technicals Point to $1,504 Target
Ripple Price: Daily Chart Suggests Limited Downside

Ripple justifies Friday’s Doji candlestick to reverse the previous weekly gain, falling within a two-month descending triangle formation. Also keeping sellers optimistic is an impending bear cross on the MACD and DMI’s clues suggesting firmer downside momentum.
The MACD histogram is close to turning red (bearish) after five days of bullish momentum, signaling that the market’s bearish bias is picking up strength.
Meanwhile, the DMI’s Downmove (D-, Orange) line tops the D+ (Upmove, blue) and the ADX (Average Directional Index, red) line, while also inching closer to the 25.00 neutral level, pointing to a gradually rising downside bias.
With this, the XRP is likely to break the immediate 100-day EMA support of $2.85 and drop toward the lower Bollinger Band (BB) surrounding $2.74.
In a case where Ripple sellers drill beneath the $2.74 support, the aforementioned two-month triangle’s bottom surrounding $2.70 will challenge them.
Below that, the $2.65-$2.64 region will be a crucial support to watch as it comprises the 200-day EMA, 50% Fibonacci retracement of the XRP’s April-July upside, and the previous resistance line from March.
Notably, Ripple’s clear break of $2.64 will make it vulnerable to a slump toward the bear’s final defense, namely an ascending support line from April, which is close to $2.33 by press time.
Alternatively, the 38.2% Fibonacci ratio and the middle BB restrict short-term XRP rebound near $2.89 and $2.91, respectively.
If Ripple buyers can break past the $2.91 resistance, the triangle’s top and the upper Bollinger Band (BB) at $3.06 and $3.08 will be key levels to watch. A successful push could lead to a gradual rally towards the August peak of $3.38, the triangle breakout target of $3.81, and possibly the all-time high (ATH) of $3.67, before setting sights on the $4.00 mark.
Ripple Price: Four-Hour Chart Favors Bulls

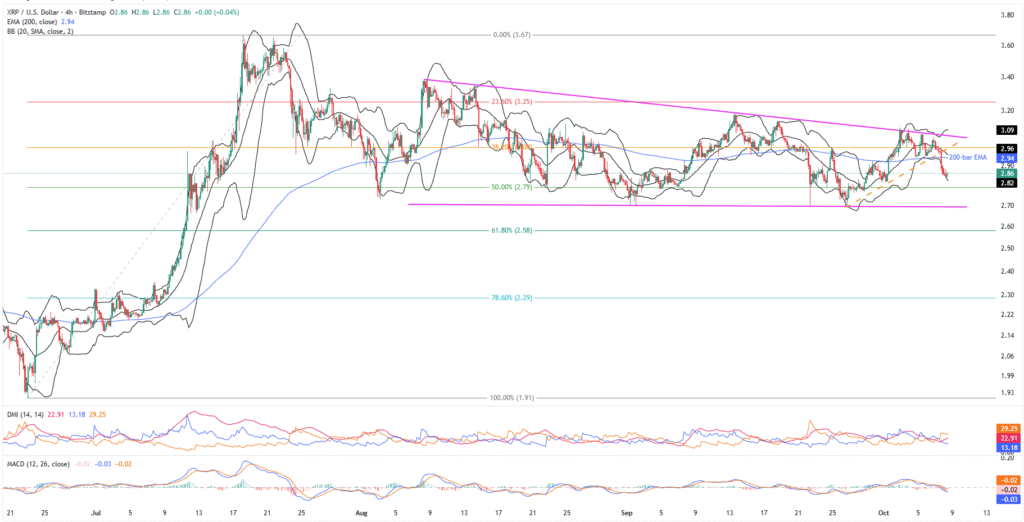
Similar to the daily chart, the XRP jostles with a short-term support on the four-hour chart, namely the lower Bollinger Band surrounding $2.83.
Notably, the downside break of a week-long ascending trendline and the 200-bar EMA, respectively near $2.96 and $2.94, joins bearish MACD and DMI signals, to reinforce the short-term bearish bias.
The 50% Fibonacci retracement of XRP’s June-July rally, around $2.79, serves as an additional downside support, alongside the deeper levels highlighted on the daily chart.
Meanwhile, the $2.94 and $2.96 restrict immediate Ripple recovery ahead of the daily chart’s higher levels.
Conclusion
Ripple’s short-term downside is gaining momentum within a multi-week bullish triangle, highlighting key support levels discussed on the daily chart. However, a daily close above $3.06 resistance could trigger the XRP’s strong recovery. That said, the altcoin’s short-term declines are possible, but the overall quarterly and yearly bullish trend is likely to remain intact.
Also read: Crypto Morning News: Bitcoin Slips to 122K as Gold Breaks $4,000 and Politics Test Market Nerves


