- Ripple price drops 5.0% in a day, snapping a two-day winning streak.
- XRP retreats from the 200-day EMA and multi-month resistance line toward the ascending support trendline from November.
- Bearish MACD and DMI signals validate Ripple’s pullback from a strong hurdle.
- A downside break of $2.32 makes XRP vulnerable to a slump toward the $1.63-$1.58 support zone.
- Ripple’s short-term downside is expected, with a broad bullish trend at risk if the price breaks below $1.58.
Ripple (XRP) price slides over 5.0% to $2.45 early Tuesday, posting its first daily loss in three, while fading the weekend recovery from a multi-month support line.
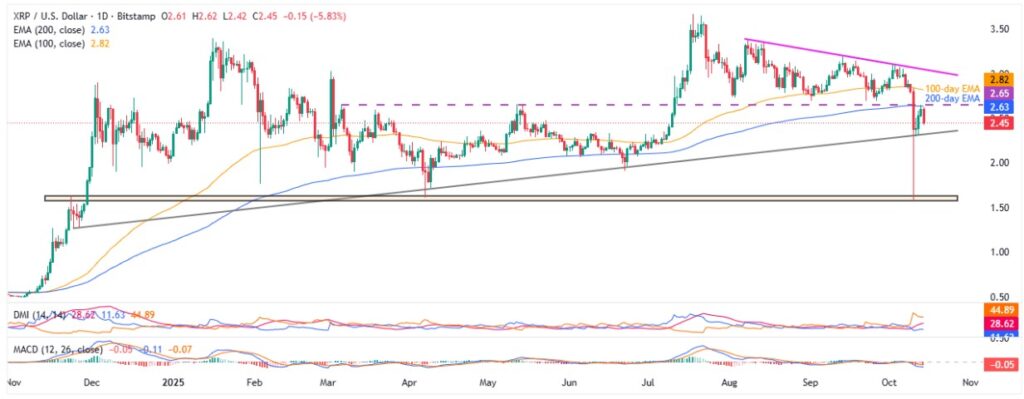
In doing so, the XRP reverses from a convergence of the 200-day Exponential Moving Average (EMA) and a horizontal resistance, previous support, from March. That said, the altcoin’s pullback also justifies bearish signals from the Moving Average Convergence Divergence (MACD) and the Directional Movement Index (DMI) momentum indicators.
It’s worth observing that downbeat trading volume and market capitalization (market cap) raise doubts on Ripple’s further south-run, highlighting the importance of a multi-month support line surrounding $2.32.
According to Santiment, Ripple’s daily trading volume eases for the fourth consecutive day after hitting a three-month-high, close to $8.41 billion, whereas the market cap retreats to $148.19 billion by press time.
Alongside the technical and trading catalysts, the market’s rush towards Gold and equities, in contrast to a pullback in the crypto demand, also seems to underpin the latest bearish bias surrounding the XRP.
Read More: Cryptocurrency Weekly Price Prediction: BTC, ETH & XRP Plummet under U.S. Risk Pressure
With this, Ripple price may face further downside, at least for the short-term, even as its slump toward the yearly low and reversal of the broad bullish trend remains questionable.
Ripple Price: Daily Chart Points To Pullback

Ripple takes a U-turn from a convergence of the 200-day EMA and a horizontal resistance from March, close to $2.33-$2.32. The altcoin’s pullback also takes clues from the bearish MACD signals (red histograms) and downbeat DMI clues to underpin the latest south-run.
That said, the DMI’s Downmove (D-, orange) line stays well beyond the Average Directional Index (ADX, red) line and the Upmove (D+, blue) line, suggesting overall strong bearish momentum. Adding strength to the downside bias is the Downmove (D-) line’s positioning beyond the 25.00 neutral level, close to 45.00 by press time.
With this, the XRP looks poised to drop toward an ascending support line from November 2024, close to $2.32.
However, the quote’s daily closing beneath highlights the odds of witnessing Ripple’s successive fall toward June’s low of $1.92 and an 11-month horizontal support area near $1.63-$1.58.
In a case where the XRP remains bearish past $1.58, it becomes vulnerable to reverse the broad bullish trend, starting with a quick fall to the mid-November swing high around $1.27 and then to the $1.00 threshold.
Alternatively, Ripple recovery remains elusive beneath the $2.63-$2.65 resistance confluence, comprising the 200-day EMA and previous support from March.
Beyond that, the 100-day EMA and a nine-week resistance line, respectively near $2.82 and $3.06, as well as the $3.00 round figure, could challenge the XRP bulls before giving them control to targeting the yearly high surrounding $3.67.
During the anticipated rise, January’s peak of $3.40 and the $4.00 threshold will be extra filters to watch.
Ripple Price: Four-Hour Chart Looks Dicey

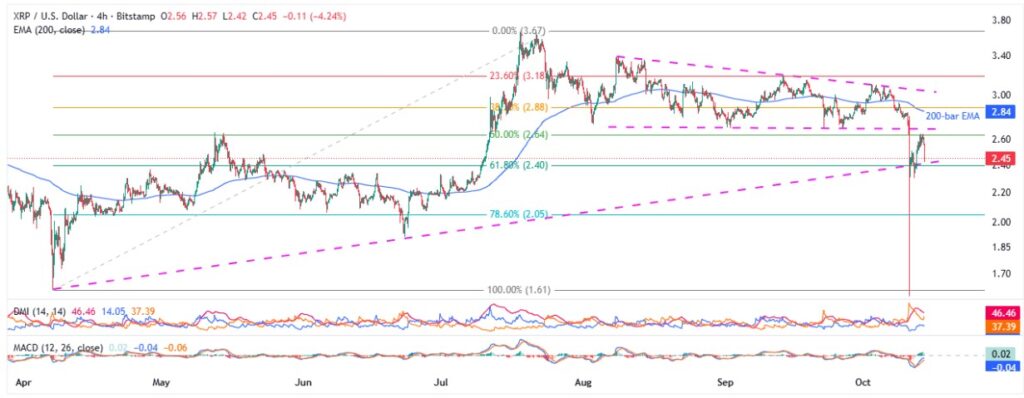
On the four-hour chart, Ripple’s latest fall drags it to an ascending support line from April, close to $2.42 at the latest. The immediate downside bias justifies bearish DMI signals, almost the same as the daily chart. However, the bullish MACD signals (greenback histograms) and the immediate support line may test short-term sellers.
If the XRP remains bearish past $2.42, Sunday’s low around $2.31 and the daily chart’s deeper levels will be in the spotlight.
Meanwhile, a 50% Fibonacci retracement of Ripple’s April-July rise, near $2.64, guards the XRP’s immediate upside.
Beyond that, a six-week-old horizontal line near $2.70, the 200-bar EMA of $2.84, and a descending resistance line from August 07, surrounding $3.05, will lure the buyers ahead of the higher levels discussed on the daily chart.
Conclusion
Ripple’s latest U-turn from the key resistance confluence joins bearish momentum indicators to suggest further downside toward the multi-month support line. However, the quote’s reversal of the yearly gains and a downside past the 11-month horizontal support needs a strong bearish catalyst.
Also read: JPMorgan Confirms Bitcoin and Crypto Trading for Clients in 2026


