- Ripple price drops over 2.0% to hit a weekly low during its four-day losing streak.
- XRP extends pullback from 200-day EMA to break ascending trendline from November and attract bears.
- Stochastic looks oversold on short-term charts, suggesting consolidation before the next fall.
- Ripple bears keep an eye on the 11-month support zone to challenge the broad bullish trend.
Ripple (XRP) refreshes a weekly low around $2.19, before bouncing off to $2.28 early Friday morning in New York, down for the fourth consecutive day amid a broad crypto downturn and risk-off mood.
In doing so, the altcoin stretches early-week reversal from the 200-day Exponential Moving Average (EMA) to break an 11-month support, now immediate resistance.
That said, the XRP’s recent fall ignores upbeat headlines surrounding the Ripple ecosystem. Among them, Ripple Labs’ $1.0 billion treasury to strengthen XRP and expansion in Africa gained major attention. On the same line is the CoinGlass data showing that nearly 75% of traders on Binance are betting on XRP long positions.
Read more Ripple news from here.
Notably, a week’s high in the trading volume and the lowest market capitalization (market cap) since early July portray the trader’s participation during the XRP’s fall and defend the downside outlook despite a four-day losing streak. That said, Ripple’s daily trading volume rises to $8.96 billion, while the market cap slides to $134.26 billion, according to Santiment.
Still, Stochastic momentum indicator flashes overheated signals on the short-term, hinting at a potential corrective bounce in prices before the next south-run.
Ripple Price: Daily Chart Suggests Further Downside

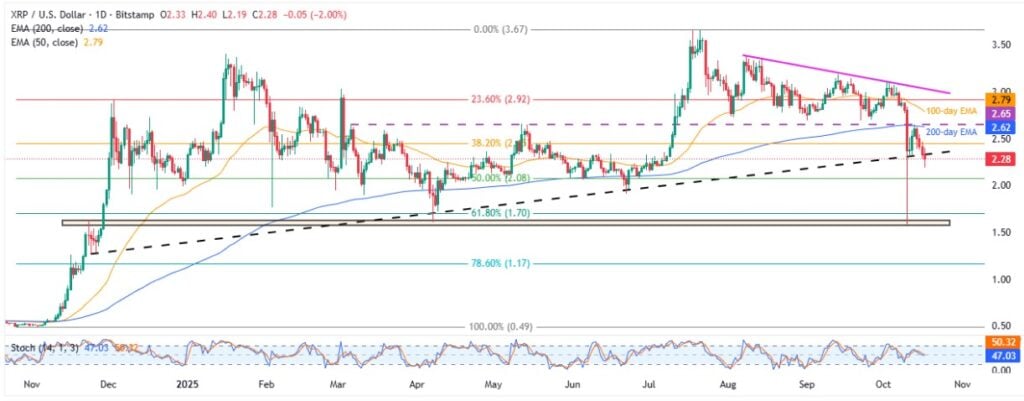
Ripple hit an 11-month low last Friday amid a broad crypto crash, before consolidating losses through Monday. The XRP’s corrective bounce, however, failed to cross a horizontal resistance from early March and the 200-day EMA.
The altcoin’s following retreat broke an ascending support line from November, now immediate resistance around $2.35, to bolster the bearish outlook as the Stochastic momentum indicator remains near the neutral 50.00 mark on the daily chart.
With this, the XRP bears look set to approach the 50% Fibonacci retracement of October 2024 to July 2025 rally, close to $2.08, followed by February’s low of $1.77 and the 61.8% Fibonacci ratio surrounding $1.70.
However, a horizontal area comprising levels from November 2024, near $1.63-$1.58, appears to be a tough nut to crack for Ripple bears.
Following that, sellers can for a gradual south-run targeting the late 2024 bottom of $0.49, with the 78.6% Fibonacci retracement of $1.17 and the $1.00 likely acting as intermediate halts.
Alternatively, XRP rebound needs a daily closing beyond the multi-month support-turned-resistance surrounding $2.35.
After which, the 200-day EMA and horizontal hurdle from March, respectively near $2.62 and $2.65, could challenge the buyers before directing them to the 100-day EMA hurdle of $2.79.
Should XRP bulls keep reins past $2.79, a 10-week descending resistance line surrounding $3.05 will be the last line of defense for the bears.
Ripple Price: Four-Hour Chart Points To Price Consolidation

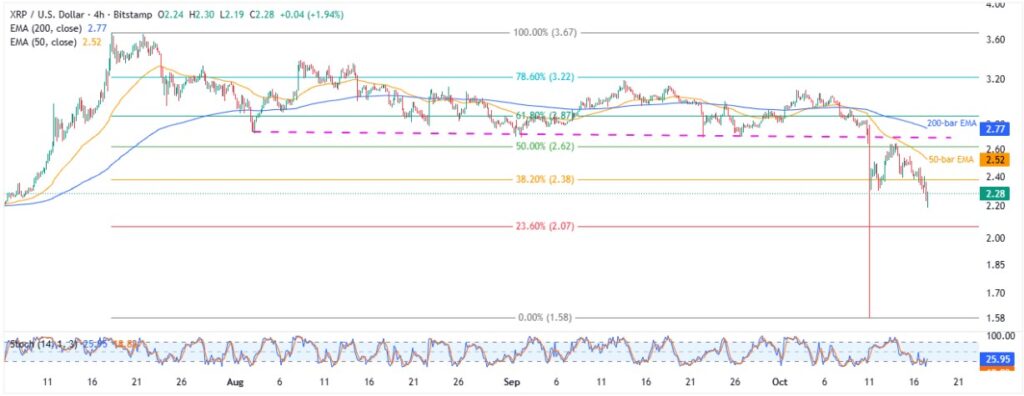
On the four-hour chart, the overheated conditions of the Stochastic, currently below the 30.00 oversold limit, suggest the XRP’s corrective bounce before the next trip to the south.
This highlights the 50-bar EMA and a 10-week horizontal resistance, close to $2.52 and $2.70 in that order, before the 200-bar EMA of $2.77.
Beyond that, the monthly top of $3.19 and the daily chart’s higher levels will be in the spotlight.
Conversely, a 23.6% Fibonacci retracement of Ripple’s July-October downturn, near $2.07, the $2.00, and the last week’s bottom of $1.58 could lure sellers during further downside, before deeper levels discussed on the daily chart.
Conclusion
Ripple’s technical breakdown lacks support from fundamental catalysts, while the overheated stochastic conditions on the short-term add strength to expectations favoring a corrective bounce in prices. However, bulls remain off the table below $2.65 and hence traders should remain cautious before taking major positions.


