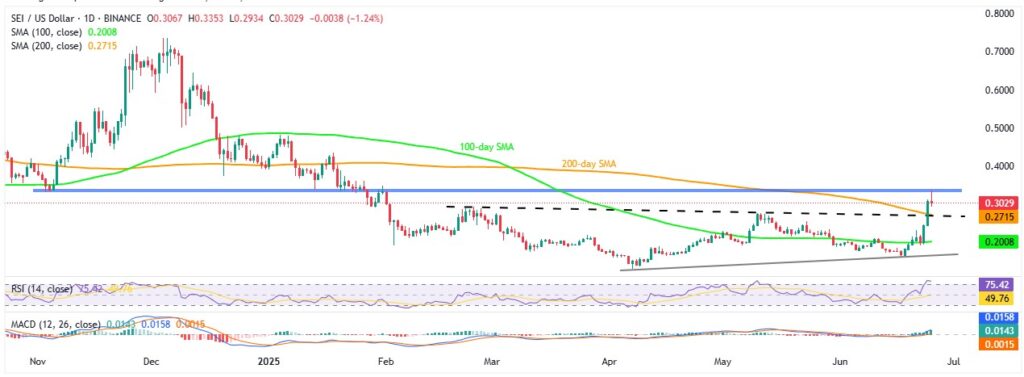
- Sei price drops 2.0% from four-month high as bulls hit the wall of resistance amid overbought RSI.
- Sellers eye the 200-day SMA and prior resistance zone, though bullish MACD momentum challenges further losses.
- Multiple support levels may challenge SEI bears, while bulls need a breakout above $0.3380 to regain control.
Sei (SEI/USD) fell nearly 2.0% intraday to $0.3000 during Wednesday’s mid-European session, retreating after reaching its highest level since early February during Asian hours. The move reflects a pullback from a seven-month-old horizontal resistance zone, triggered by overbought conditions on the 14-day Relative Strength Index (RSI).
Despite the retreat, the overall bullish structure remains intact. A sustained breakout above the 200-day Simple Moving Average (SMA) and a four-month-old former resistance line now acting as support, combined with positive signals from the Moving Average Convergence Divergence (MACD) indicator, continue to support the bullish case. While a short-term correction appears likely, these factors suggest buyers are still in the game.
SEI/USD: Daily chart signals limited downside

Source: Tradingview
The SEI/USD pair faces renewed selling pressure as overbought RSI conditions combine with a strong resistance zone — formed by levels dating back to early November 2024 — between $0.3000 and $0.3080, prompting the latest pullback.
However, the downside remains contested. A confluence of the 200-day SMA and a four-month-old resistance-turned-support, now around $0.2715–$0.2700, could cushion the decline, especially as the MACD remains bullish.
A clear break below $0.2700 would likely expose SEI to further losses, initially targeting March’s high near $0.2180, then the 100-day SMA around $0.2000. If selling pressure persists, the rising trendline from early April, currently near $0.1650, could act as the final line of defense for bulls.
On the flip side, a daily close above $0.3080 would invalidate the bearish outlook, opening the door toward the mid-January swing high at $0.4340, followed by the 2024 peak near $0.4800, and potentially the $0.5000 psychological barrier.
SEI/USD: Four-Hour chart points to bullish exhaustion

Source: Tradingview
On the four-hour chart, a six-week horizontal support zone around $0.2750–$0.2730 appears to be attracting SEI/USD sellers, particularly amid overbought RSI conditions and a reversal from the 100% Fibonacci Extension (FE) level of the April–June rally at $0.3375.
Should the pair break below this immediate support, the 200-bar SMA near $0.2030 and a former resistance-turned-support from early May around $0.1870 are expected to offer a strong defense for bulls before the focus shifts to broader daily chart support zones.
On the upside, a confirmed breakout above the $0.3375 Fibonacci level could open the door toward the psychological $0.3500 mark, with further gains likely targeting resistance levels highlighted on the daily timeframe.
In summary, SEI/USD shows signs of a near-term pullback, but the downside appears limited unless key support levels give way.


