- Shiba Inu extends rebound from 100-day SMA, breaking through key multi-month resistance.
- Bullish MACD signals, lack of overbought RSI steer SHIB buyers toward the 200-day SMA.
- May’s high is the breakout level SHIB/USD needs to erase its 35% YoY decline.
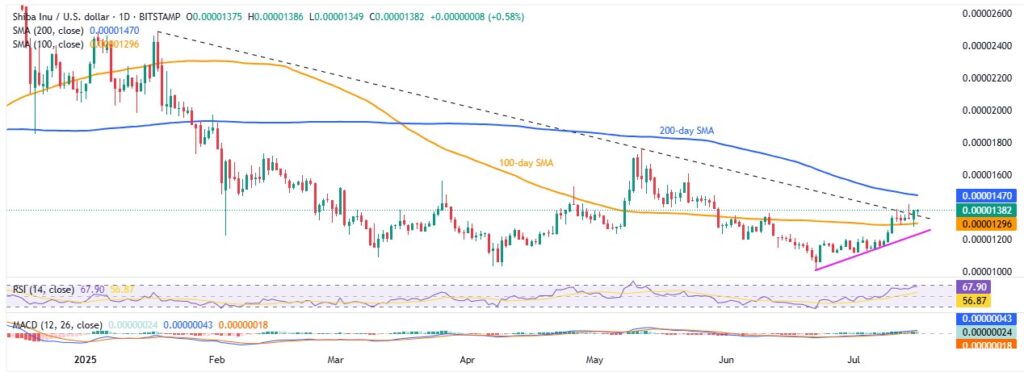
Shiba Inu (SHIB) rises 0.90% intraday to $0.00001380 heading into Wednesday’s U.S. session. In doing so, the meme coin extends the previous day’s rebound from the 100-day Simple Moving Average (SMA) and breaks above a downward-sloping resistance line from January, which now acts as support.
Notably, bullish signals from the Moving Average Convergence Divergence (MACD) indicator and the absence of overbought conditions in the 14-day Relative Strength Index (RSI) align with this breakout, guiding SHIB/USD toward the 200-day SMA — especially as it attempts to recover from a 35% year-to-date loss in 2025.
SHIB/USD: Daily chart keeps buyers hopeful

Be it the sustained recovery from the 100-day SMA or the clear breakout of the multi-month resistance line—now acting as support—the Shiba Inu bulls have all the momentum needed to extend their latest rally. This upside bias is further supported by bullish MACD signals and an upbeat but not overbought 14-day RSI.
As a result, the SHIB/USD pair is targeting the monthly high of $0.00001416 marked on Monday before challenging the key 200-day SMA hurdle at $0.00001470.
A decisive break above the 200-day SMA could propel SHIB bulls toward the highs recorded in March and April, near $0.00001565 and $0.00001760, respectively.
If the bulls maintain control past $0.00001760, the January-end swing low at $0.00001969 will be the final support for bears before SHIB potentially heads toward the yearly peak of $0.00002486.
On the downside, a daily close below the resistance-turned-support line at $0.00001345 could push SHIB prices toward the 100-day SMA support at $0.00001296.
However, bears will likely remain cautious unless SHIB breaks decisively below a three-week ascending support line near $0.00001230 at press time. Beyond that, the yearly low of $0.00001009, marked in June, would come into focus.
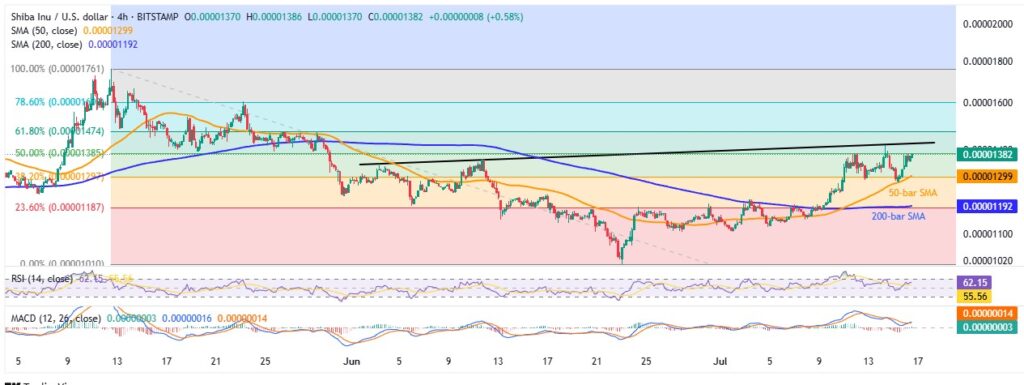
SHIB/USD: Four-Hour chart cites multiple trading hurdles

While the daily chart shows a clear path for SHIB/USD bulls toward the 200-day SMA, the four-hour chart reveals an immediate challenge: a six-week ascending resistance line near $0.00001430 that must be overcome before buyers can gain full momentum.
Additionally, the 78.6% Fibonacci Retracement of the May-June decline, around $0.00001605, presents a further upside barrier before SHIB can target higher daily chart resistance levels.
On the downside, the 50-bar SMA and 200-bar SMA provide short-term support near $0.00001300 and $0.00001190, respectively, with the daily chart support levels becoming important if prices dip below these points.
Overall, Shiba Inu appears poised for a short-term rally, but a complete reversal of its 2025 losses remains uncertain.


