- Solana price dwindles after two-day losing streak amid cautious mood ahead of top-tier catalysts.
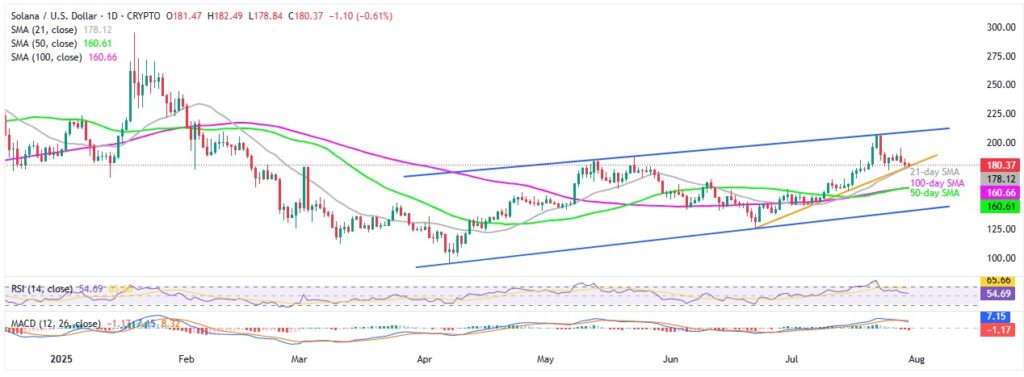
- 21-day SMA, five-week ascending trend line and fortnight-long triangle restrict immediate SOL moves.
- RSI, MACD suggest slower grind toward south but $160.00 is a tough nut to crack for SOL/USD bears.
- FOMC and White House ‘crypto report’ set stage for high-volatility trading on Wednesday.
Solana (SOL/USD) price remains indecisive early Wednesday, mildly offered near $180.00 by the press time, as bulls and bears jostle after a two-day losing streak while bracing for heavy volatility due to the scheduled release of top-tier market catalysts.
Among them, the White House’s release of the ‘Crypto Report’ after a 180-day review and monetary policy announcements from the U.S. Federal Open Market Committee (FOMC) gained major attention.
Apart from the pre-data consolidation, a convergence of 21-day Simple Moving Average (SMA) and a five-week rising trend line, as well as a fortnightly-old triangle’s support, also play their roles to test the SOL/USD bears on the key day.
The 14-day Relative Strength Index (RSI) and Moving Average Convergence Divergence (MACD) suggest a slower grind south for SOL, but strong support levels could offer interim halts within its four-month-old bullish channel.
Solana: Daily Chart Lures Short-Term Sellers

Although a convergence of the 21-day SMA and an ascending trend line from late June to challenge the SOL/USD pair’s immediate downside around $180.00, a gradually declining RSI line toward the 50.00 neutral level, and the bearish MACD signals attract short-term sellers.
That said, a daily closing beneath the $180.00 support confluence could direct Solana bears toward the 50-day and 100-day SMA joint surrounding $160.00. However, the aforementioned bullish channel’s bottom could challenge the sellers around $140.00 afterward.
In a case where the SOL/USD remains bearish past $140.00, the odds of witnessing a downside toward the yearly low of $95.33, with intermediate halts around June’s bottom of $126.12 and the $100.0 threshold, can’t be ruled out.
Alternatively, May’s peak of around $188.00 and the $190.00 round-figure could lure near-term Solana buyers during the quote’s rebound from the $180.00 key support. Even so, the top line of a bullish channel, close to $210.00, and early January swing high around $224.00 will be strong resistances for the buyers to cross before confirming the bullish trend.
Solana: Four-Hour Chart Portrays Trader’s Indecision

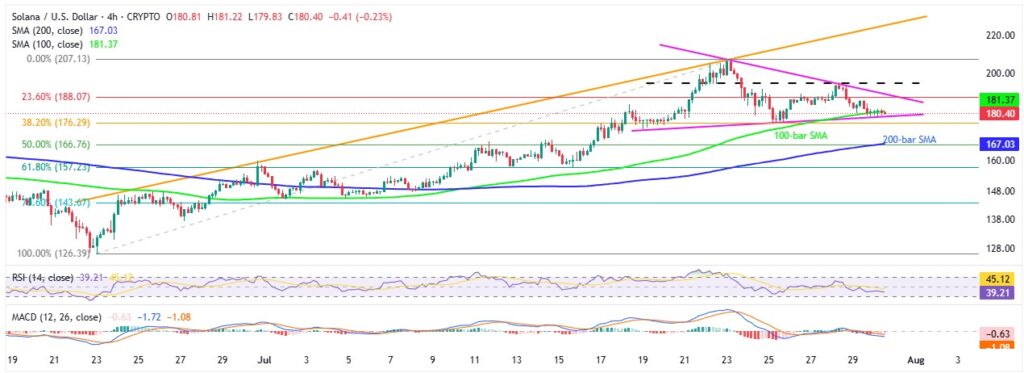
On the four-hour chart, the SOL/USD pair clings to the 100-bar SMA surrounding $181.00 while staying within a two-week symmetrical triangle, currently between $191.00 and $180.00.
It’s worth noting that the RSI and MACD conditions appear more bearish on the four-hour chart than the daily formation, which in turn joins the quote’s reversal from a week-long horizontal hurdle, to keep sellers hopeful.
However, the 200-bar SMA and 50% Fibonacci Retracement of June-July upside, near $166.80, appears to be a strong near-term challenge to the bears even if they manage to smash the $180.00 support. Should the Solana price remain weak past $180.00 and break the $166.80 support, the deeper levels discussed on the daily chart will be in the spotlight.
Meanwhile, the SOL/USD rebound remains elusive unless it crosses the stated triangle’s top boundary of $191.00, as well as a week-long horizontal resistance line close to $195.00. Following that, the $200.00 threshold, the monthly high near $206.00, and an upward-sloping resistance line from late June, close to $226.00, will be eyed before the daily chart resistances.
Overall, the Solana price remains downbeat and can break the immediate support should the crypto market turn weak following the key fundamental catalysts. However, the road towards the south will be long and bumpy.


