- Solana price retreats from a week’s high, snapping a two-day winning streak with a nearly 2.0% fall.
- SOL pulls back within a multi-week rising wedge as the market consolidates ahead of key U.S. data.
- Weak momentum shows limited downside pressure, while trading above key SMAs keeps Solana buyers optimistic.
- A short-term pullback is possible, but the overall recovery trend remains strong.
Solana (SOL) price snaps two-day winning streak early Thursday, reversing from a week’s high to $207.20, down 1.60% intraday, as the crypto market consolidates ahead of the key U.S. data.
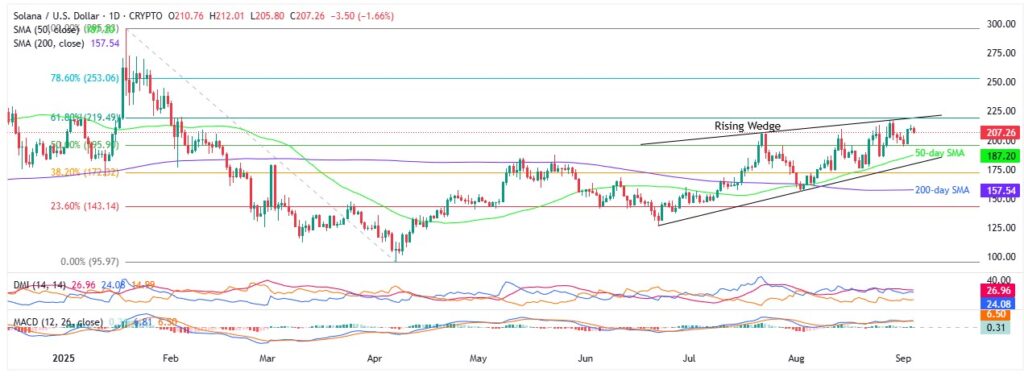
Notably, the SOL’s latest pullback takes place within a 10-week-old “rising wedge” bearish chart formation amid sluggish signals from the Moving Average Convergence Divergence (MACD) and the Directional Movement Index (DMI) momentum indicators.
On the same line, daily trading volume and market capitalization signal weak trader participation, challenging SOL sellers. According to Santiment, the daily trading volume has dropped for the second consecutive day to $5.84 billion, while the market cap has retreated from a week’s high to $112.19 billion.
With this, the altcoin’s latest weakness looks more like a healthy consolidation, rather than a trend change signal, unless it breaks the key $184.00 support. Read why!
Solana Price: Daily Chart Keeps Bullish Bias Intact

Even if Solana’s price action since late June portrays a “rising wedge” bearish chart formation, the quote’s sustained trading beyond the 50-day and 200-day Simple Moving Averages (SMAs) joins downbeat momentum indicators to keep buyers hopeful.
That said, DMI shows the Average Directional Index (ADX in red) hovers above the neutral 25.00 level, currently near 27.00, while the Upmove line (D+ in blue) nears the neutral 25.00 level, indicating sturdy support for the uptrend. Further, the Downmove line (D- in orange) remains near 6.00, signaling very weak downside momentum.
On the same line, the MACD signals are also sluggish, posting mildly green (bullish) bars of late.
Given that, the 50% Fibonacci retracement of the quote’s January-April downside, near $196.00, could restrict the SOL’s short-term downside ahead of the 50-day SMA of $187.00.
Following that, the stated wedge’s lower boundary, near $184.00, will be the key support level to watch as a daily closing beneath the same would confirm the bearish chart formation, suggesting a theoretical target of $92.00.
During Solana’s fall toward the anticipated theoretical target of $92.00, the 200-day SMA level of $157.00, June’s bottom of $126.00, and he yearly low near $95.00 can challenge the bears.
On the contrary, a convergence of the wedge’s top and the 61.8% Fibonacci retracement, also known as the “golden Fibonacci ratio,” around $220.00, appears to be a tough nut to crack for the SOL bulls.
Beyond that, the bulls can aim for the early January swing high near $223.00 and the yearly peak of $295.00.
Solana Price: Four-Hour Chart Tests Bulls

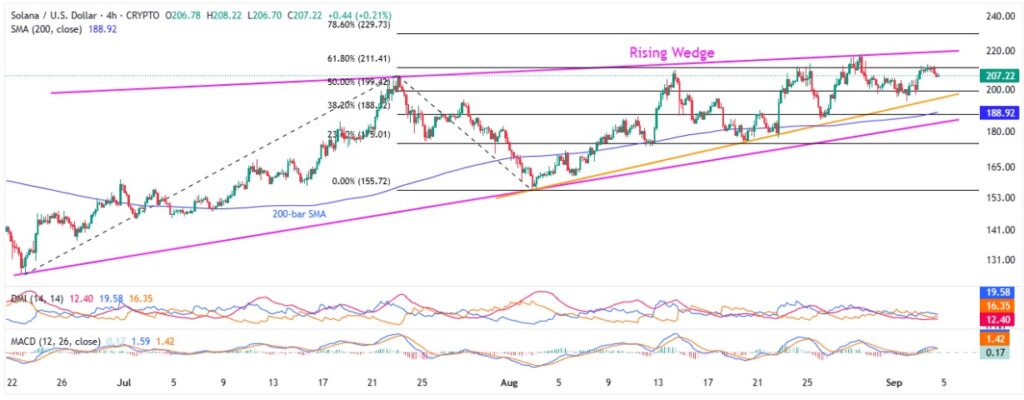
On the four-hour chart, the SOL retreats from a 61.8% Fibonacci Extension (FE) of its June-August moves, currently around $211.00.
The pullback lacks momentum support per the DMI and the MACD indicators. That said, all three lines of the DMI remain well beneath the 25.00 neutral level, whereas the MACD signals also remain near zero.
With this, Solana’s latest pullback may visit the $200.00 threshold, close to the 50% FE support of $199.00.
Still, a month-old ascending trendline near $196.00 may limit further downside; if broken, the 200-bar SMA around $188.00 could offer support before SOL tests the key $184.00 wedge bottom and deeper targets on the daily chart.
Alternatively, the 61.8% FE level near $211.00 precedes the rising wedge’s upper boundary of $220.00 and the 78.6% FE surrounding $230.00 to restrict Solana’s fresh upside before the higher levels discussed on the daily chart.
Conclusion
Solana’s recent pullback may not face headwinds during the short-term, mainly due to the market’s positioning for the key U.S. activity and employment data, as well as pullback from short-term key resistance. However, the broad recovery trend since April is likely to hold unless the quote drops beneath the $174.00 key support level.


