- Solana price extends recovery from key support confluence, still down over 10.0% in 2025.
- Bulls need validation from $190.00 and $212.00 to reverse yearly losses.
- Solana’s break of $160.00 puts $142.00 as buyers’ final safety net.
- SOL rebounds from SMA convergence, joining neutral RSI to suggest short-term upside within four-month bullish channel.
Solana (SOL) price gains 1.0% to hit an intraday high near $170.00 in early Thursday’s trading, extending the previous day’s rebound from the key moving average confluence.
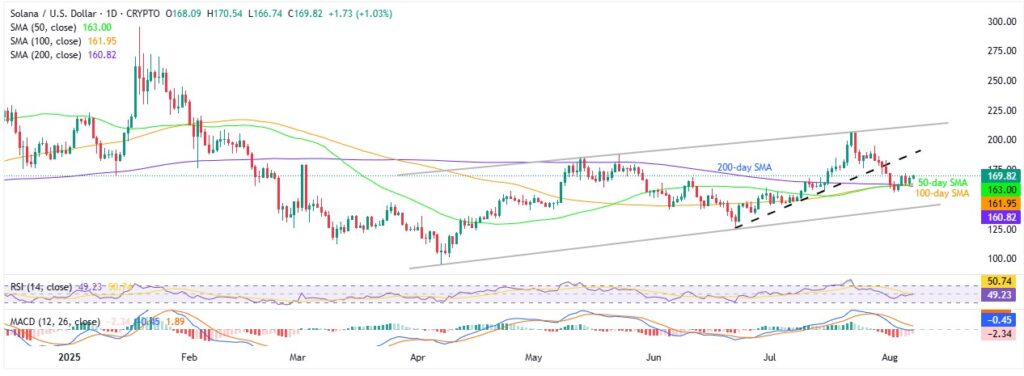
The SOL’s U-turn from a convergence of the 50-day, 100-day, and 200-day Simple Moving Averages (SMAs) joins neutral conditions of the 14-day Relative Strength Index (RSI), also to strengthen the latest recovery. Also keeping buyers hopeful is the altcoin’s sustained trading within a four-month-long ascending trend channel.
It’s worth noting that the latest rebound in the prices also defends the recovery in Solana’s market cap, after hitting a month’s low, to around $91.33 billion at the latest. The trading volume, however, stays soft near $3.88 billion as we write.
Still, the quote needs to reverse the late-July downside break of a short-term support line and flip the bearish signals from the Moving Average Convergence Divergence (MACD) indicator to recover from its 10% yearly loss.
Solana Price: Daily Chart Suggests Short-Term Recovery

Solana recently bounced off the crucial $160-$163.00 support zone comprising the 50-day, 100-day, and 200-day SMAs. The SOL recovery also took clues from the neutral RSI while staying within a four-month bullish channel, suggesting a continuation of the short-term upside moves.
Even so, the late July breakdown of a six-week trend line support, now resistance around $190.00, joins the bearish MACD signals to challenge bulls.
A successful breakout of $190.00 will face the bullish channel’s upper boundary surrounding $212.00, acting as the last hurdle on the SOL buyer’s way of reversing the yearly losses. This highlights multiple resistances around $240.00 and $270-$273.00 before driving prices to the yearly peak of $295.11.
On the contrary, a daily closing beneath the $163.00-$160.00 support cluster isn’t an open invitation to the Solana bears, as the lower boundary of the bullish channel, close to $142.00, will act as the buyer’s last defense.
Should the SOL price remain weak past $142.00, June’s bottom near $126.00 and the yearly low marked in April near $95.00, as well as the $100.00 threshold, will be in the spotlight.
Solana Price: Four-Hour Chart Highlights Multiple Upside Hurdles

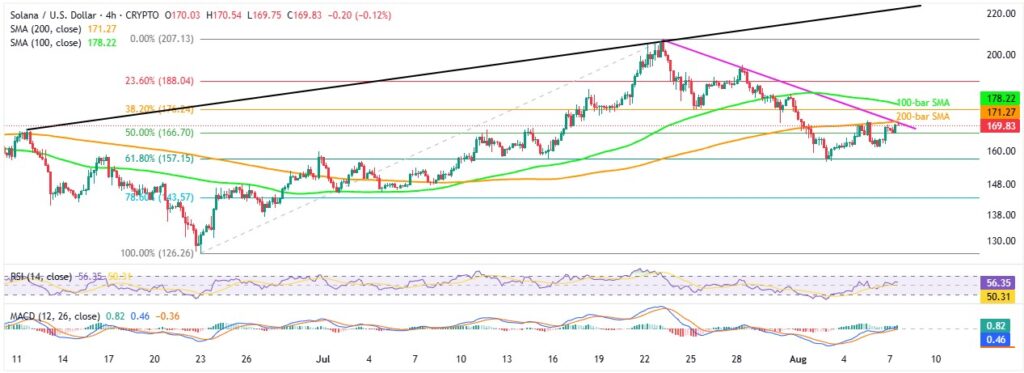
Multiple resistances yet to be validated for the SOL bulls on the four-hour chart.
Among them, a convergence of the 200-bar SMA and a fortnight-old descending trend line, close to $172.00, adjacent to the 100-bar SMA of $179.00, restricts short-term SOL upside.
Following that, $195.00, July’s peak of near $206.00, and an ascending trend line from early June, around $223.00, could test the buyers before highlighting the daily chart levels.
Alternatively, the 61.8% Fibonacci retracement of Solana’s June-July upside, near $157.00, offers immediate support to the quote ahead of directing them to $145.00 and June’s bottom of $126.00.
If the SOL bears remain dominant past $126.00, deeper levels discussed on the daily chart could appear.
Conclusion
Solana’s rebound from the key SMA confluence is gaining strength, supported by a steady RSI and its position within a four-month bullish channel, hinting at further short-term upside.
However, the support-turned-resistance line from late June, along with bearish MACD signals, could limit upside momentum, and hence a true reversal of the yearly loss remains unlikely unless SOL secures a daily close above $212.00.


