- Solana price slides 5% after breaking key short-term support as traders brace for this week’s major data/events.
- SOL breaks two-week support line, 100-bar EMA on four-hour chart, with bearish MACD & DMI backing intraday sellers.
- Two-month support, 200-day EMA and broader bullish channel defend Solana buyers as daily oscillators are not bearish.
- Short-term charts show bearish signals, but overall upside bias stays intact.
Solana (SOL) suffers a 5% intraday on Monday, snapping a two-day winning streak, while falling to the lowest level in over a week to $181.50. Even so, the SOL remains firmer for the second straight month in August, up 5.0% Month-over-Month (MoM) at the latest.
The altcoin’s latest weakness draws inspiration from the broader crypto market’s weakness on Monday, as traders remain cautious ahead of key events this week, including the annual Jackson Hole symposium of global central bankers.
Also favoring the SOL sellers is a break of a two-week-old ascending trend line support and the 100-bar Exponential Moving Average (EMA), along with pressuring the 21-day EMA. Furthermore, the four-hour chart portrays bearish signals via the Directional Movement Index (DMI) and the Moving Average Convergence Divergence (MACD) indicators, adding strength to the short-term downside momentum.
Notably, a three-day high trading volume also backs Solana’s latest fall and drags the market capitalization to a week’s low. That said, the SOL’s daily trading volume rises to $5.38 billion, according to Santiment, whereas the Market Cap slips to its lowest since August 11, at around $97.94 as of writing.
Still, a multi-month bullish trend channel, the quote’s sustained trading beyond the longer-term EMAs on the daily chart, and upbeat oscillators keep the SOL buyers hopeful.
Solana Price: Daily Chart Highlights Challenges for Bears

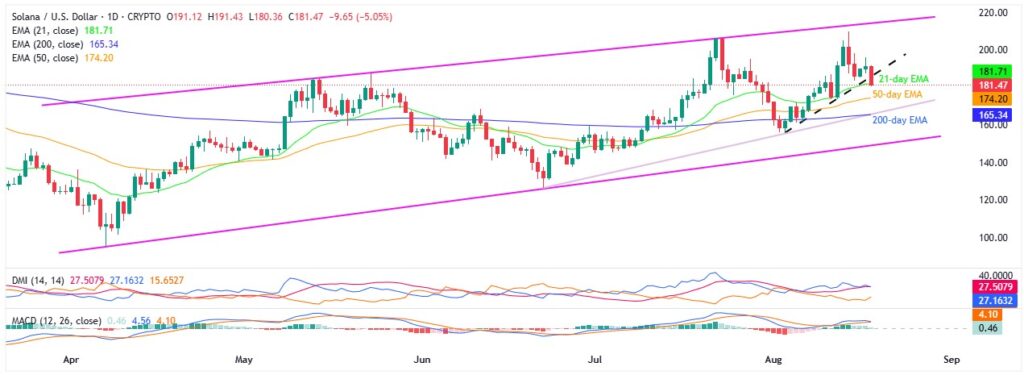
Solana’s downside break of a two-week-old ascending trend line allows the sellers to poke the 21-day EMA of 181.60 while keeping eyes on the 50-day EMA of 174.20.
However, the quote’s sustained trading beyond the 200-day EMA, a two-month support line, and keeping the bullish trend channel from April challenge the SOL bears from taking control.
It’s worth noting that the potential bearish crossover on the Moving Average Convergence Divergence (MACD) still lacks confirmation, while the Directional Movement Index (DMI) continues to support bullish momentum. The DMI’s Upmove line (blue), or D+, holds above the neutral 25.00 level, and the Average Directional Index (ADX) line (red) stays near 27.00, making it harder for sellers to gain control.
With this, the SOL’s rebound from the 50-day EMA support of $174.20 can’t be ruled out; if not, then a convergence of the 200-day EMA and a two-month ascending trend line, near $165.00, will be a major threat to sellers.
Even if the prices break $165.00 support confluence, a 4.5-month-old bullish trend channel, currently between $148.00 and $215.00, could act as the buyer’s last defense.
Alternatively, SOL’s recovery remains elusive beneath the support-turned-resistance line surrounding $184.00.
Following that, $195.00 and the $200.00 threshold might test Solana buyers before giving them control.
In that case, July’s top and the current monthly high, respectively near $206.00 and $210.00, will precede the aforementioned bullish channel’s top of $215.00 to offer final tests to the north-run before directing bulls toward the yearly high of $295.00.
Solana Price: Four-Hour Chart Favors Short-Term Sellers

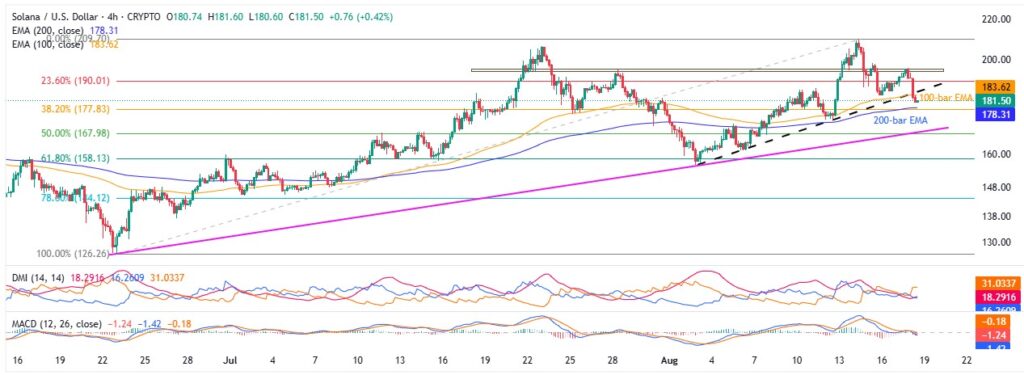
On the four-hour chart, Solana not only breaks the fortnight-old trend line support, but also conquers the 100-bar EMA, both currently coinciding near $184.00.
The support confluence break joins the bearish MACD signals and downbeat DMI indications to favor short-term SOL sellers. That said, the DMI’s Downmove line (D–, orange) holds firmly above the 25.00 threshold, indicating strong bearish momentum, while both the Upmove line (D+, blue) and the ADX (red) remain below 25.00, reflecting limited buyer strength.
With this, the SOL is well set to challenge the 200-bar EMA support of $178.00, a break of which could drive prices down to an ascending trend line from late June, close to $168.00. Following that, deeper levels discussed on the daily chart will gain the Solana seller’s attention.
Alternatively, Solana’s corrective bounce should reclaim $184.00 support-turned-resistance to convince short-term buyers. Even so, a month-old horizontal resistance near $196.00 could act as the final challenge for the bulls ahead of targeting the daily chart levels.
Conclusion
Solana confirms short-term bearish momentum by smashing a two-week rising trend line and the 100-bar EMA on the four-hour chart. Further, bearish MACD signals and a firm DMI down move line add pressure, luring intraday sellers. Still, the multi-month bullish channel keeps broader upside hopes alive.


