- Solana price edges higher after a positive week, with eyes on the upcoming Nasdaq listing of SOL Strategies Inc.
- SOL’s rebound from mid-Bollinger Band, backed by mildly bullish DMI & MACD signals, boosts buyer confidence.
- Solana’s five-month recovery faces a tough test from the upper Bollinger Band, the Golden Fibonacci Ratio, and a key multi-month resistance line.
- The Solana pullback remains unimportant beyond the 200-day SMA, but a short-term rising wedge piques traders’ interest.
- SOL appears well-set to carry its three-year uptrend, though intermediate pullbacks remain possible.
Solana (SOL) price posts a modest increase to $207.50 early Monday, while stretching the previous daily and weekly gains as upbeat fundamentals direct buyers toward the key resistance levels.
The SOL Strategies Inc., a Canadian company focused exclusively on the Solana ecosystem, gets Nasdaq approval to list shares with a ticker “STKE”. The trading is expected to start from September 9, 2025, opening a broad source of institutional and retail participation for the promising firm.
Read Detail Here: Promising SOL Strategies Set for Nasdaq Debut, Boosting Solana’s Institutional Profile
The news also fuelled the SOL’s trading volume, as well as printed an improvement in the market capitalization, allowing the quote to extend its recovery from short-term key supports. According to Santiment, Solana’s daily trading volume jumped to a three-day high of $5.21 billion, while the market cap also edged higher to $112.34 billion, suggesting active trader participation in the altcoin’s rise.
Notably, the momentum indicators like Moving Average Convergence Divergence (MACD) and the Directional Movement Index (DMI) also show that momentum is favoring the prices to validate the latest rise.
Still, a slew of upside hurdles stand tall to challenge the SOL’s further advances. Read details!
Solana Price: Daily Chart Portrays Gradual Recovery

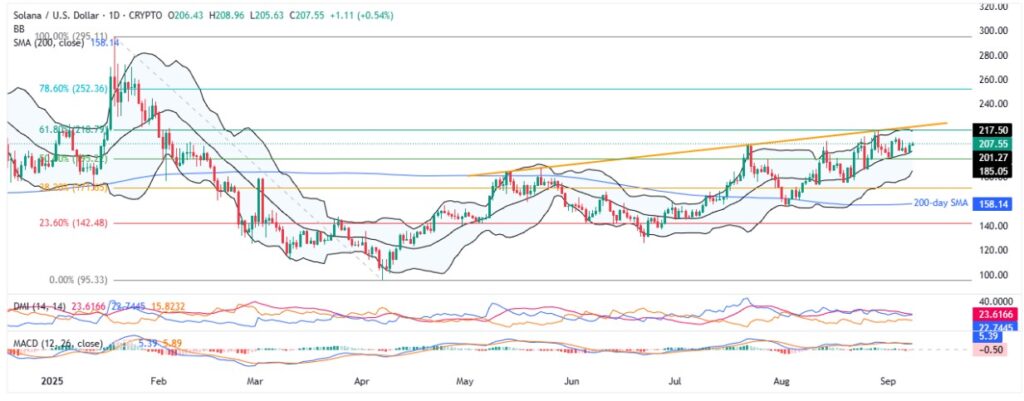
Solana’s latest rebound took support from the middle Bollinger Band (BB) to defend its five-month uptrend, backed by upbeat fundamentals. On the same line are modestly positive momentum signs from the DMI indicator, even as the MACD remains sluggish.
That said, the DMI’s Average Directional Index (ADX in red) hovers around the neutral 25.00 level, currently near 24.00, while the Upmove line (D+ in blue) nears the neutral 23.00 level, indicating sturdy support for the uptrend. Further, the Downmove line (D- in orange) remains near 15.00, signaling weak downside momentum.
This favors the quote’s current run-up targeting a convergence of the upper BB and 61.8% Fibonacci retracement of Solana’s January-April fall, also known as the Golden Fibonacci Ratio, around $217-$218.00.
Beyond that, an upward-sloping resistance line from early May, close to $221.00 at the latest, will be a tough nut to crack for the bulls, a break of which could allow them to target the late January swing high surrounding $245.00, multiple hurdles near $270.00, and the yearly top of $295.11.
Meanwhile, the middle BB and the 50% Fibonacci ratio, respectively around $201.00 and $195.00, restrict short-term SOL downside during a pullback, which is less likely.
However, Solana’s weakness past $195.00 will be concerning as it will challenge the lower Bollinger and the 200-day SMA support, close to $185.00 and $158.00 in that order, acting as the final line of defense for the bulls.
Solana Price: Four-Hour Chart Highlights Rising Wedge

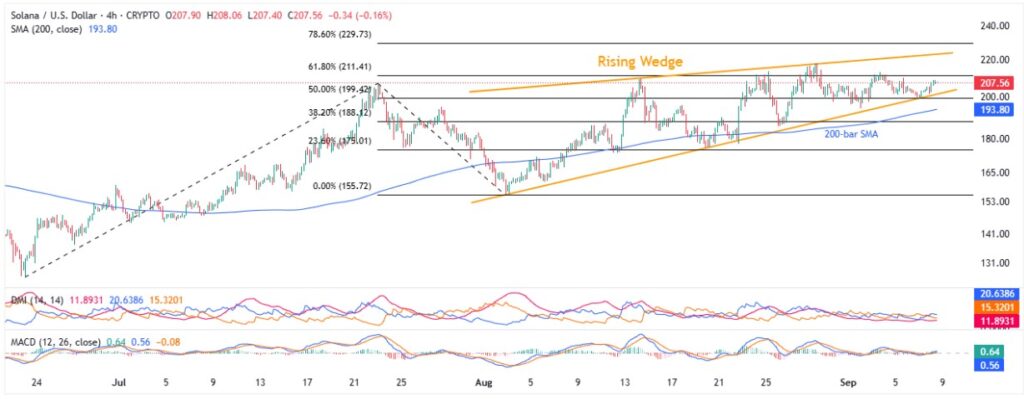
A five-week-old rising wedge bearish chart formation, currently between $202.00 and $224.00, sparks the SOL trader’s interest on the four-hour chart.
That said, the MACD flashes bullish signals, and the DMI’s Upmove line (Blue) is above the Downmove (Orange) line, signaling upside momentum, even as the ADX line (Red) remains weak.
With this, the altcoin is likely to stay within the stated bearish chart pattern and faces the 61.8% Fibonacci Extension (FE) of its June-August moves, currently around $211.00, as the immediate upside hurdle.
Meanwhile, the confirmation of a rising wedge bearish pattern, via a downside break of $202, will need validation from the 200-bar SMA support of $193.80 to convince sellers.
Below that, the deeper levels discussed on the daily chart and the rising wedge’s theoretical target of $140.00 will gain the market’s attention.
Conclusion
Solana’s recent rise face headwinds during the short-term, mainly due to the multiple key resistance levels around $220.00. However, the broad recovery trend since April is likely to hold unless the quote drops beneath the $158.00 key support level.
Also read: Cryptocurrency Weekly Price Prediction: BTC, XRP Rebound, But ETH Lags, amid Fed Rate Cut Buzz


