- Solana price rises to a three-week high after biggest daily jump since late June.
- Successful rebound from key EMAs favor SOL bulls within bullish channel patterns on daily and four-hour charts.
- Momentum indicators, trading volume also favor Solana’s steady recovery trend since April.
- Overbought RSI on four-hour challenges immediate within broad bullish trend.
Solana (SOL) price rises over 3.0% to $199.00 early Wednesday, after reaching a three-week high near $200.00.
It’s worth noting that the SOL bulls cheered the biggest daily rise since June 23 the previous day amid broadly softer U.S. Dollar after the U.S. Consumer Price Index (CPI) data for July. Adding strength to the upside momentum was a clear bounce off the 21-day Exponential Moving Average (EMA) within broad bullish channel formations on the daily and four-hour charts.
Solana’s daily trading volume also jumps to a three-week high of $10.53 billion, according to Santiment. In comparison, the market cap rises to around $107.38 billion, up for the second consecutive day to the highest since June 22.
Additionally, the 14-day Relative Strength Index (RSI) and the Moving Average Convergence Divergence (MACD) also suggest a continuation of the SOL’s latest run-up within the broader channel formations, even if the four-hour chart tests buyers of late.
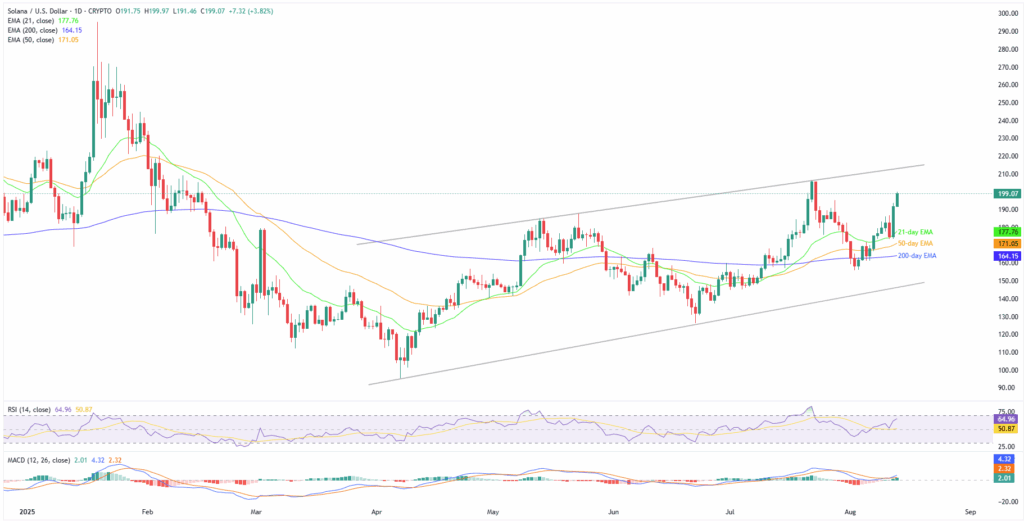
Solana Price: Daily Chart Suggests Further Upside

Solana’s clear U-turn from a 21-day EMA, currently around $177.60, joins the above-50.0 but not overbought RSI and the bullish MACD signals to support buyers as they hit a multi-day top.
With this, the SOL appears well-set to challenge July’s high of $206.30.
However, the upper boundary of a four-month-old ascending trend channel, close to $214.00, could challenge the bulls afterward, especially as the RSI is close to the 70.00 overbought limit.
If not, then early January swing high near $223.00 and multiple hurdles near $240.00 could challenge the SOL’s further upside before highlighting the yearly peak of $295.00.
On the contrary, May’s high of $187.00 can act as an immediate support to watch during Solana’s fresh retreat, a break of which will shift the market’s attention to the 21-day EMA support of $177.70.
Notably, the SOL’s weakness past the 21-day EMA won’t be confirming the bearish trend as the 50-day and the 200-day EMAs, respectively, near $171.00 and $164.00, could challenge the downside momentum.
Above all, Solana buyers can stay hopeful unless the prices defy the bullish channel formation by breaking the $145.00 support.
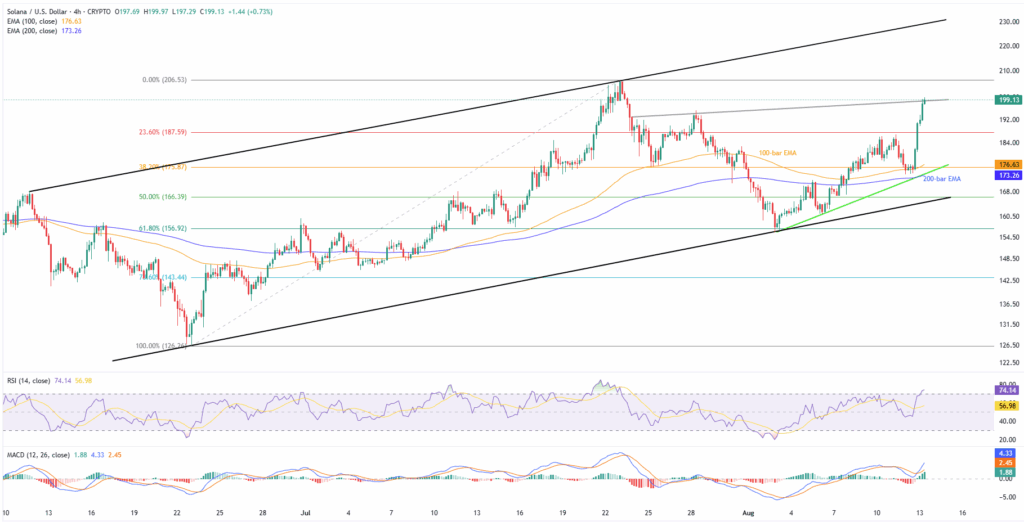
Solana Price: Four-Hour Chart Tests Buyers

On the four-hour chart, the SOL’s run-up hits a hurdle, namely a three-week-old ascending trend line surrounding $199.00, close to the $200.00 round-figure resistance. The nearby resistances gain attention as the RSI turns overbought and suggests a consolidation in the prices.
Should the Solana buyers ignore the overbought RSI, July’s high near $206.30, and multiple hurdles discussed on the daily chart, they will lure them before a two-month bullish trend channel’s top, surrounding $230.
Alternatively, the 23.6% Fibonacci Retracement of Solana’s June-July upside, near $187.60, followed by the 100-bar EMA of $176.60, could act as immediate support levels to watch during the fresh pullback.
Following that, the 200-bar EMA and a week-long trend line support, around $173.00, could challenge the SOL buyers before the bullish channel’s lower boundary, near $164.00, acting as the final defense of bulls.
Conclusion
Although Solana pokes a short-term resistance, its broader bullish trend remains intact, mainly backed by the trend-favoring MACD signals and a clear rebound from the key EMA supports.
Still, technical cues from the RSI and channel patterns indicate that the uptrend is likely to persist, at a steady, measured pace rather than a sharp rally.


