- Solana price battles to hold former resistance as support, remains capped below 200-day EMA.
- Bullish RSI and MACD signal recovery, but $160 breakout is key for SOL upside.
- Failure to hold $146 support may trigger a drop to $126 and reinforce bearish momentum.
Solana (SOL/USD) struggles to hold its recovery from former resistance, despite posting a 1.65% intraday high near $149.40 during Wednesday’s European session. In doing so, the SOL/USD pair jostles with the 200-bar Exponential Moving Average (EMA) on the four-hour chart, while remaining below the 200-day EMA on the daily timeframe—even as momentum indicators such as the Relative Strength Index (RSI) and the Moving Average Convergence Divergence (MACD) suggest early bullish potential.
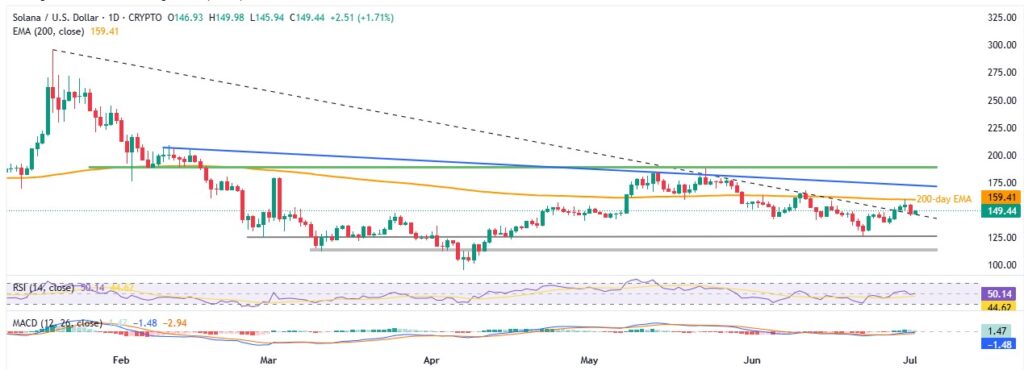
SOL/USD: Daily chart teases buyers

Source: TradingView
The RSI staying above 50.00, alongside bullish MACD signals, supports the SOL/USD pair’s recent rebound from the previous resistance line extending from January 2025, near $146.00 at press time. This setup hints at gradually building buying momentum and room for further upside.
That said, Solana bulls must clear the 200-day EMA barrier at $160.00 to confirm control, before targeting a five-month descending resistance trendline near $173.00 and then the horizontal supply zone around $190.00—capping gains since early February.
On the downside, failure to hold $146.00 may see Solana retreat toward a key horizontal support area near $126.00, marked by price action since late February. Below that, the zone between $113.00 and $112.00—active for four months—serves as the last major support before bears take aim at the 2025 low of $95.33.
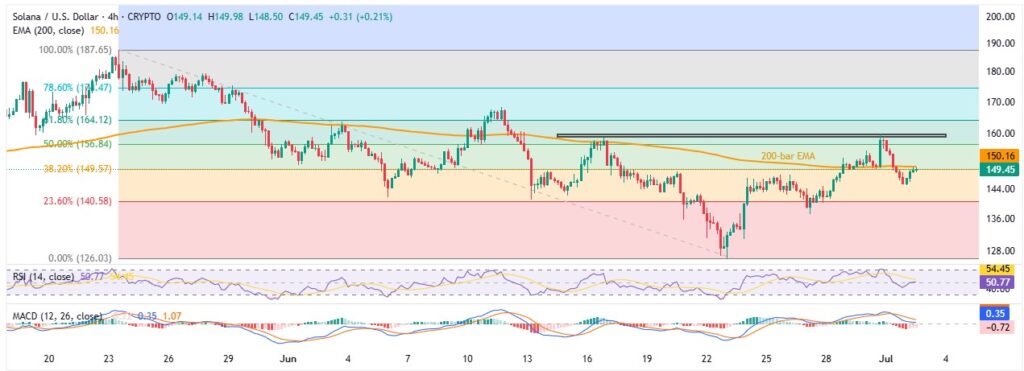
SOL/USD: Four-Hour chart highlights bearish channel

Source: TradingView
On the four-hour chart, Solana struggles with the 200-bar EMA resistance at $150.20, while remaining below the two-week “Double Top” pattern near $160.00. June’s high at $168.34 adds another key resistance level before the focus shifts to higher targets on the daily chart.
On the flip side, the late-June swing low at $137.24 provides interim support, complementing broader downside levels highlighted on the daily timeframe.
It should be noted that the RSI holds firm, while the MACD flashes bearish signals on the four-hour chart—indicating near-term hurdles for Solana buyers.
Overall, Solana remains on a cautiously bullish path. While a break above $160.00 is possible, any upside is likely to unfold gradually.


