- Solana’s recovery wobbles after two-day rally off key support zone.
- 100-day SMA caps SOL recovery below five-month descending resistance and 200-day SMA.
- Recovery from crucial support and bullish momentum signals hint at consolidation rather than reversal of SOL’s 2025 losses.
- SOL/USD bulls need a decisive move past 189.00 to reclaim control.
Solana (SOL/USD) price remains defensive around $146.20 during Wednesday’s U.S. session, struggling to sustain the previous two-day recovery from key support as the 100-day Simple Moving Average (SMA) puts pressure on buyers.
Despite bouncing off a five-month horizontal support zone, SOL/USD has still recorded nearly a 22% loss so far in 2025. Notably, the 14-day Relative Strength Index (RSI) and the Moving Average Convergence Divergence (MACD) indicator support the recent rebound, suggesting further consolidation of this yearly loss. However, multiple upside hurdles loom large, challenging hopes for a sustained return of the bullish trend.
SOL/USD: Daily chart signals limited upside room

Source: Tradingview
Even though the near-50.0 RSI and an impending bullish crossover on the MACD signal SOL’s potential to push beyond the immediate hurdle—the 100-day SMA at $146.80—buyers will face significant resistance from a downward-sloping trend line dating back to January and the 200-day SMA, near $152.00 and $169.30 respectively.
It’s important to note that any recovery past $169.30 will require confirmation from a horizontal resistance zone marked since early February, around $188.00-$189.00, and the key $190.00 level.
If cleared, the SOL/USD pair’s swift move toward the $200.00 psychological milestone becomes possible, with further targets at the January 6 peak and yearly high near $223.00 and $295.00, respectively, likely to attract bullish interest.
Alternatively, SOL’s pullback could revisit the multi-month horizontal support between $126.00 and $125.00.
That said, a decisive break below this level would expose a longer-term horizontal support zone near $112.00-$113.00, representing the bulls’ last major defense before prices risk dropping to the yearly low of $95.33.
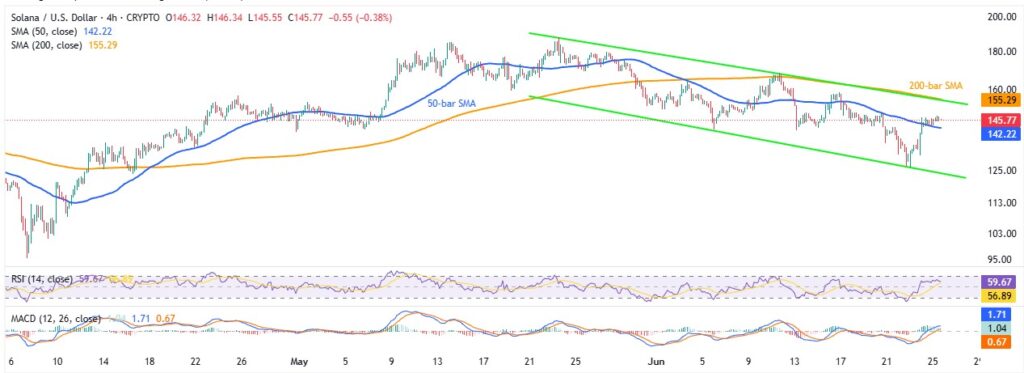
SOL/USD: Four-Hour Chart portrays a bearish channel

Source: Tradingview
Unlike the daily chart, the four-hour chart of the SOL/USD pair suggests a gap before reaching key resistance, as it traces a five-week-long bearish channel.
The convergence of this descending trend channel’s top and the 200-bar SMA, near $155.50, forms a crucial resistance level for bulls to overcome before aiming for the targets highlighted on the daily chart.
On the downside, the 50-bar SMA around $142.40-$142.35 offers immediate support, especially backed by upbeat RSI and bullish MACD signals. Below that, the bearish channel’s lower boundary near $124.00 will test the SOL/USD bears before reaching the support zones noted on the daily timeframe.
Overall, Solana’s price may see a short-term recovery, but a full reversal of the broader downtrend remains elusive.


