- Solana price snaps three-day rally, retreats from 5.5-month high after breaking key resistance from March.
- SOL faces overbought RSI near key Fibonacci hurdles, but MACD strength and breakout momentum keep bulls in control.
- SOL/USD risks profit-booking under $190, though real bearish pressure only builds below $155.
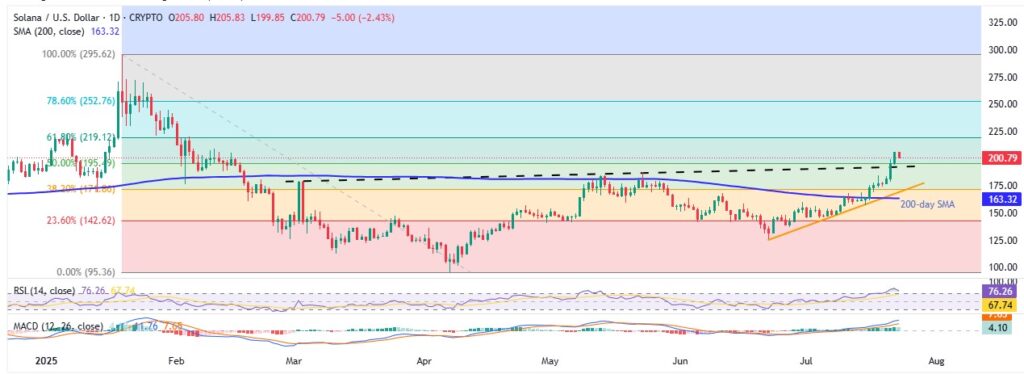
Solana price (SOL/USD) surged to $206.32 on Tuesday, its highest since mid-February, following a strong breakout above key March resistance—which has now turned into support. This rally was driven by growing optimism around on-chain growth and rising institutional interest.
However, during Wednesday’s European session, SOL eased back to $200 as the 14-day Relative Strength Index (RSI) showed overbought conditions, triggering a short-term pullback.
Despite this, SOL remains firmly above the 200-day Simple Moving Average (SMA) and a rising support line formed over the past month. Bullish momentum is confirmed by the Moving Average Convergence Divergence (MACD), supporting the near-term uptrend.
The overbought RSI warns traders to expect some consolidation or a minor dip before the next leg up in this broader bullish run.
SOL/USD: Daily Chart Signals Gradual Run-up

SOL/USD bulls remain strong after breaking a 4.5-month rising trendline, now solid support near $190, despite the latest pullback. Supported by bullish MACD, steady trading above the 200-day SMA, and a late-June ascending support line, the uptrend looks intact — but overbought RSI warns of a slight pullback if price falls below $190 during consolidation.
If that happens, bears could first test support near the weekly top at $185 and a month-old support around $170, before challenging June’s low near $168 and the 200-day SMA at $163. Further downside filters include the late-June swing high near $160 and March’s peak at $148, leading toward a monthly low around $126 — the last line of defense for buyers.
On the upside, short-term SOL bulls face tests at the recent multi-month peak of $206.00, before targeting key Fibonacci retracement levels at $220 (61.8%) and $252 (78.6%) of the January-April drop. Clearing $252 could open the door to resistance near $270-$272, followed by the yearly peak at $295 and the psychological $300 level.
SOL/USD: Four-Hour Chart Also Defends Bullish Bias

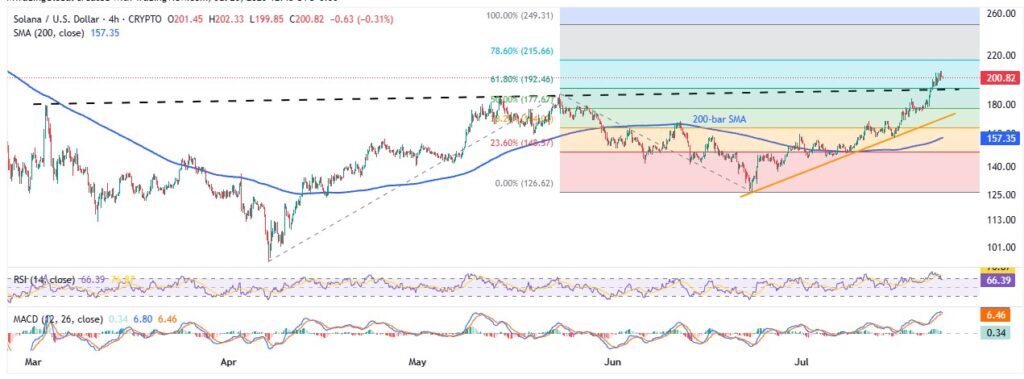
Much like the daily chart, the four-hour chart confirms SOL/USD’s bullish momentum with a clear break above the 200-bar SMA, sustained trading beyond a month-old support line, and clearance of the March resistance — now a key support near $190.
Bullish MACD signals reinforce upside bias, though the overbought 14-day RSI, hovering near 80, suggests a gradual climb rather than a sharp rally.
A period of consolidation around the $190 support could follow. A break below this level may invite short-term sellers, first targeting the 50% Fibonacci Extension (FE) of the April–June move around $178, then the month-old support near $170, and finally the 200-bar SMA at $157. After that, key daily chart levels come back into focus.
On the flip side, a breakout beyond the recent high of $206.30 could trigger a move toward the 78.6% and 100% FE levels near $215 and $250 respectively. However, a sustained rally beyond that would shift attention to resistance levels highlighted on the daily chart.
Overall, Solana remains technically strong despite the latest retreat after hitting the multi-month high.


