- Solana price cool off after hitting a fresh six-month high, snapping three-day winning streak.
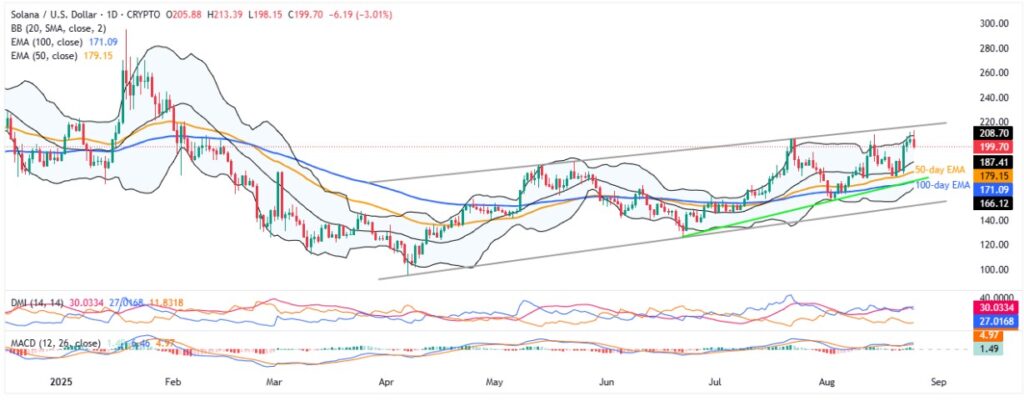
- SOL eases from the upper Bollinger Band, within a bullish channel from April.
- DMI and MACD both suggest firmer upside momentum, but post-Powell consolidation tests Solana bulls near key resistances.
- Short-term pullback in SOL price is possible, but the broader multi-month recovery stays intact.
Solana (SOL) price slips to $200.00 early Monday, down over 3.0% intraday after poking the highest level since early February, as crypto traders consolidate Friday’s heavy gains, earned through Federal Reserve (Fed) Chairman Jerome Powell’s Jackson Hole Speech. Also testing the SOL bulls is the cautious sentiment ahead of this week’s top-tier growth and inflation data from the U.S., as the Fed is still data-dependent, despite opening doors for further rate cuts.
The SOL’s latest retreat coincides with a two-week high in trading volume, flagging correction risk, especially when the quote eases from key technical resistance levels. That said, Solana’s daily trading volume jumps to the highest level since August 14, to $12.12 billion according to Santiment, the marketcap cools from a multi-month high to $109.43 billion as we write.
Notably, oscillators like the Moving Average Convergence Divergence (MACD) and the Directional Movement Index (DMI) portray a sturdy momentum support to the SOL’s upside, raising doubts on the quote’s further weakness.
Hence, the recent pullback in Solana price reflects broader market caution ahead of key U.S. data but poses little threat to SOL’s steady rise since early April.
Solana Price: Daily Chart Keeps Bullish Bias Intact

Despite facing pressure from the upper Bollinger Band (BB), Solana bulls keep the reins at the highest level in over six months. The quote’s sustained trading beyond the key Exponential Moving Averages (EMAs) joins bullish MACD signals and upbeat DMI to defend the upside bias.
That said, the DMI’s up move line (D+ in blue) holds well above the neutral 25.00 level, and the Average Directional Index (ADX in red) prints a notable 30.00 reading, indicating a solid trend. Further, the down move line (D- in orange) remains near 5.00, signaling weak support for price pullback.
The SOL’s latest retreat is likely to face challenges around the middle BB of $187.00 and May’s peak of $180.00.
If Solana falls below $180.00, the 50-day EMA support of $179.00 might challenge the bears before a convergence of the 100-day EMA and two-month ascending support line, close to $171.00 at the press time.
Above all, the lower BB and an upward-sloping trend line from April, forming part of the broad bullish channel, respectively near $165.00 and $151.00, will act as the final defense of the SOL buyers before giving control to the bears.
Alternatively, the SOL’s fresh recovery needs to cross the aforementioned upper BB, near $209.00, to restore bullish confidence.
Still, the bullish channel’s top surrounding $217.00 might act as an additional upside hurdle, a break of which could direct prices toward the early January swing high near $223.00 and the yearly peak of $295.00.
Solana Price: Four-Hour Chart Points To Pullback

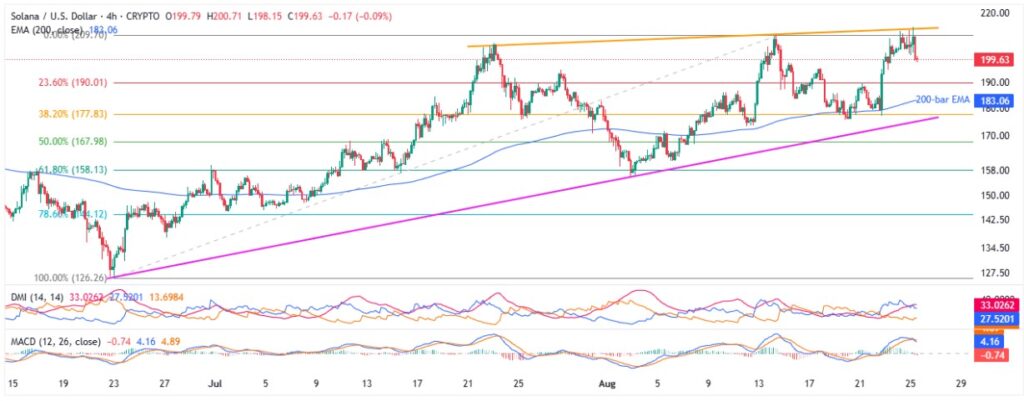
On the four-hour chart, a potential bearish cross on the MACD joins the quote’s retreat from a month-old resistance to lure short-term sellers.
However, the DMI indicators remain supportive to the SOL buyers, challenging the quote’s declines past short-term supports. That said, the DMI’s up move line (D+ in blue) remains firmer past the neutral 25.00 level, and the Average Directional Index (ADX in red) prints a notable 33.00 reading, indicating a solid trend. Further, the down move line (D- in orange) remains near 10.00, signaling weak support for price pullback.
Hence, while the quote’s retreat appears imminent, a full bullish trend reversal seems unlikely for now.
That said, intraday SOL sellers may aim for the 200-bar EMA support of $183.00 before an upward-sloping support line from late June, close to $175.00. Further, Solana’s downside break of $175.00 could expose it to the deeper downside levels discussed on the daily chart.
On the flip side, a clear break above the month-old resistance near $212 could attract buyers and shift focus to higher targets on the daily chart.
Conclusion
Solana mirrors broader crypto market consolidation, easing from the key upside hurdles, and suggesting further intraday losses toward the short-term support levels. However, support from the Bollinger Band, bullish trend channel, and Solana’s network strength keeps the broader uptrend intact.
Also read: Powell’s Rate Cut Hint Ignites Markets: Crypto Volatility as Dovish Shift Begins


