- Solana rises to the highest level since February, reverses Monday’s slump with three-day winning streak, but key resistances challenge buyers.
- SOL faces strong resistance at upper BB, five-week resistance line, and bullish channel’s top, as Treasury news boosts buying pressure.
- DMI and MACD both signal bullish momentum, suggesting more upside for Solana as it stays beyond key support levels.
- SOL buyers may clear immediate upside hurdles, but refreshing yearly top appears an uphill task.
Solana (SOL) price jumps to the highest level since early February, up for the third consecutive day, with over 5.0% intraday gains to $214.40 early Thursday.
The SOL’s three-day winning streak wipes out Monday’s heavy drop, while cheering upbeat institutional demand for the SOL.
As per the Strategic SOL Reserve website, the number of corporate SOL treasuries has grown to 13, together holding around 8.27 million SOL worth $1.72 billion. The total holdings now constitute 1.44% of Solana’s total supply.
Solana’s upbeat trading volume and market capitalization also backs the latest run-up, which in turn keeps the buyer’s hopeful. That said, the SOL’s daily trading volume remains firmer around the weekly high, marked on Monday, surrounding $12.57 billion, whereas the market cap jumps to the highest level in seven months, to $114.83 billion, according to Santiment.
Besides strong fundamentals and growing market interest, Solana’s successful trading above key support levels also portrays its upside strength.
Additionally, bullish signals from the momentum indicators like the Moving Average Convergence Divergence (MACD) and the Directional Movement Index (DMI) add to the buyers’ hopes for new multi-day highs.
Hence, the SOL appears well-set to overcome the immediate upside hurdles and brace for a fresh multi-month high. However, it’s run-up toward the yearly peak appears long and bumpy.
Solana Price: Daily Chart Keeps Bullish Bias Intact

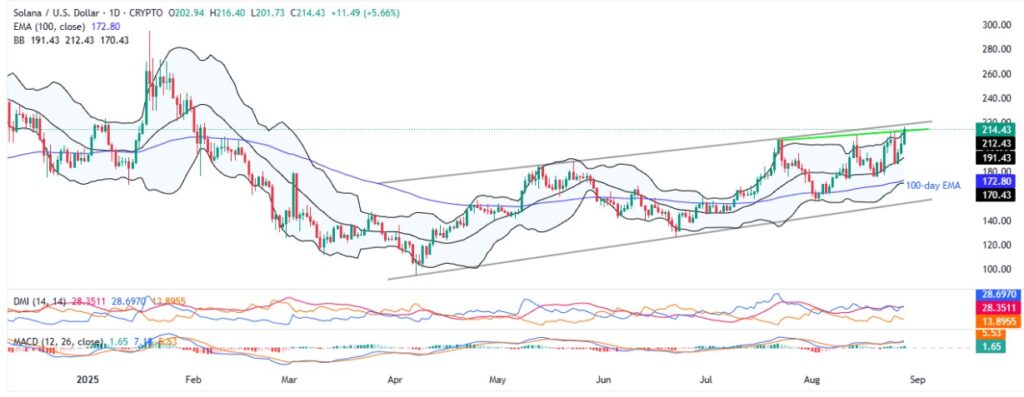
Even after facing pressure from the upper Bollinger Band (BB) and a month-long rising trend line, Solana bulls keep the reins at the highest level in over six months. That said, the quote’s sustained trading beyond the key Exponential Moving Averages (EMAs) join bullish MACD signals and upbeat DMI to defend upside bias.
That said, the DMI’s Upmove line (D+ in blue) holds well above the neutral 25.00 level, and the Average Directional Index (ADX in red) prints a notable 28.00 reading, indicating a solid support for the uptrend. Further, the Downmove line (D- in orange) remains near 13.00, signaling very weak support for price pullback.
However, the SOL bulls have to post a daily closing beyond the convergence of a monthly resistance line and upper Bollinger Band (BB) to keep the reins. Even so, an upper line of an ascending trend channel from April, close to $220.00, will be a tough nut to crack.
In a case where Solana post a daily closing past $220.00, the bulls can aim for the early January swing high near $223.00 and the yearly peak of $295.00.
On the flip side, July’s high near $206.00 acts as an immediate support to watch during the SOL pullback.
Below that, the $200.00 threshold, the middle BB surrounding $196.00 and August 11 low of $173.00 may lure the sellers.
Still, a convergence of the 100-day EMA and the lower BB, close to $172.00-$170.00, will be a tough nut to crack for the bears before retaking control.
Above all, the SOL buyers keep the reins unless witnessing a daily closing beneath the stated multi-month channel’s bottom surrounding $154.00.
Solana Price: Four-Hour Chart Also Favors Bulls

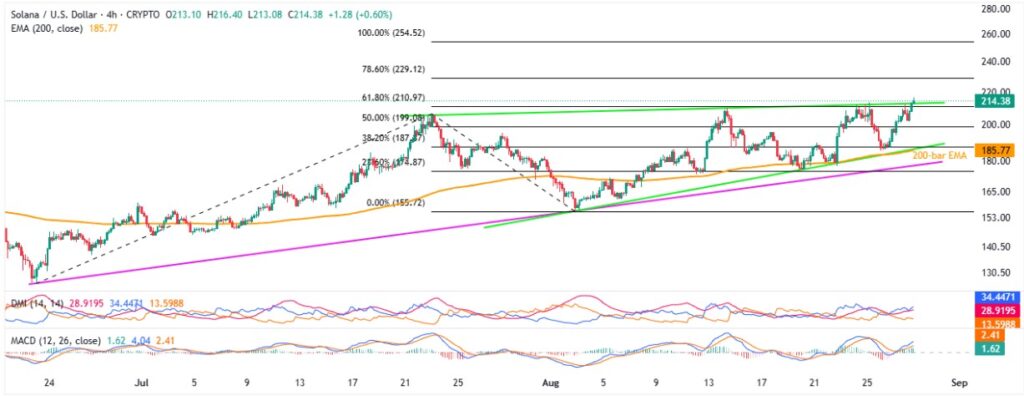
On the four-hour chart, the SOL price recently crossed a month-old resistance, forming part of a short-term triangle. The upside momentum gains support from the bullish MACD signals and the upbeat DMI signals, with ADX and Upmove line both staying firmer past the 25.00 neutral level.
Hence, the buyers appear well-set to aim for the 78.6% and 100% Fibonacci Extensions (FE) of its June-August moves, respectively near $230.00 and $255.00. Following that, the higher levels discussed on the daily chart will be in the spotlight.
Alternatively, the monthly resistance-turned-support line surrounding $213.00 restricts short-term SOL downside before the $200.00 round figure.
Following that, the 200-bar EMA and the stated triangle’s bottom will challenge the bears around $185.00. Also, an ascending trend line from June, near $178.00, joins the league of short-term key support levels.
Conclusion
Solana (SOL) portray a strong upside potential, backed by bullish technical signals and growing institutional interest. Still, immediate resistance near $220 may slow the bullish momentum, but the altcoin’s broad upside trend is likely to hold.
Also read: Market Digest: Bitcoin Holds at 112K as Solana Surges and U.S. Tariffs Hit India


