- Solana price rises 2.0%, extending weekend recovery from the 21-day SMA within a two-week-old triangle.
- Bullish RSI, MACD signals direct SOL buyers toward $239 hurdle, testing the triangle formation.
- A drop below $224.00 could trigger a short-term pullback in Solana, but the overall bullish trend holds above $193.00.
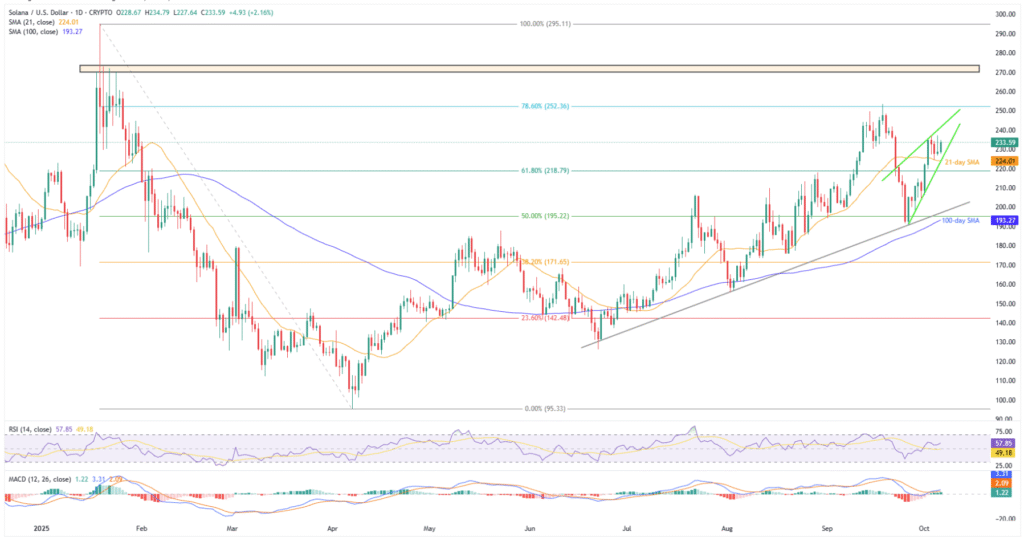
On Monday, Solana (SOL) price jumps 2.0% to $234, holding its weekend rebound from the 21-day Simple Moving Average (SMA) while staying within a two-week-old triangle.
Alongside the SOL’s U-turn from a 21-day SMA, bullish signals from the 14-day Relative Strength Index (RSI) and Moving Average Convergence Divergence (MACD) momentum indicators also keep buyers optimistic.
Still, a pullback in trading volume, despite upbeat market capitalization (market cap), and a triangle formation, fuels the odds of a healthy consolidation in the Solana prices before the next rally. According to Santiment, Solana’s daily trading volume retreats from $7.13 billion to $6.44 billion, while the market cap hits a five-day high of $127.51 billion.
With this, the risk of short-term consolidation is high, but the broader bullish trend remains intact as long as SOL stays above $193.00.
More Details: Solana News Today: $91 Million Short at Risk as SOL Eyes $270
Notably, the U.S. Dollar’s likely recovery on the potential U.S. government re-open, following a week-long shutdown, as well as mixed market sentiment, adds strength to the hopes of witnessing the SOL pullback.
Solana Price: Daily Chart Keeps Buyers Hopeful Beyond $193

Solana’s clear recovery from the 21-day SMA gains support from the above 50.00 RSI line, not overbought, and bullish MACD signals (green histogram) to underpin the upside outlook within a two-week-old ascending triangle formation, currently between $239.00 and $224.00.
Should the quote rise past $239.00 hurdle, the 78.6% Fibonacci retracement of Solana’s January-April downturn, close to $252.00, quickly followed by September’s high of near $253.50, will be on the bull’s radar.
Beyond that, multiple top marks in January around $273.00 and the yearly peak of $295.11, quickly followed by the $300.00 psychological magnet, will be in the spotlight.
Alternatively, a downside break of the $224.00 support confluence, encompassing the stated triangle’s bottom and the 21-day SMA, could trigger a short-term SOL downturn toward an ascending support line from late June, close to $197.00.
That said, the $200.00 threshold and the 100-day SMA support of $193.00 are additional downside filters for the bears to watch.
In a case where Solana price weakens past $193.00, the bears could retake control to initially target August’s low of around $155.00.
Solana Price: Four-Hour Chart Highlights Triangle Formation

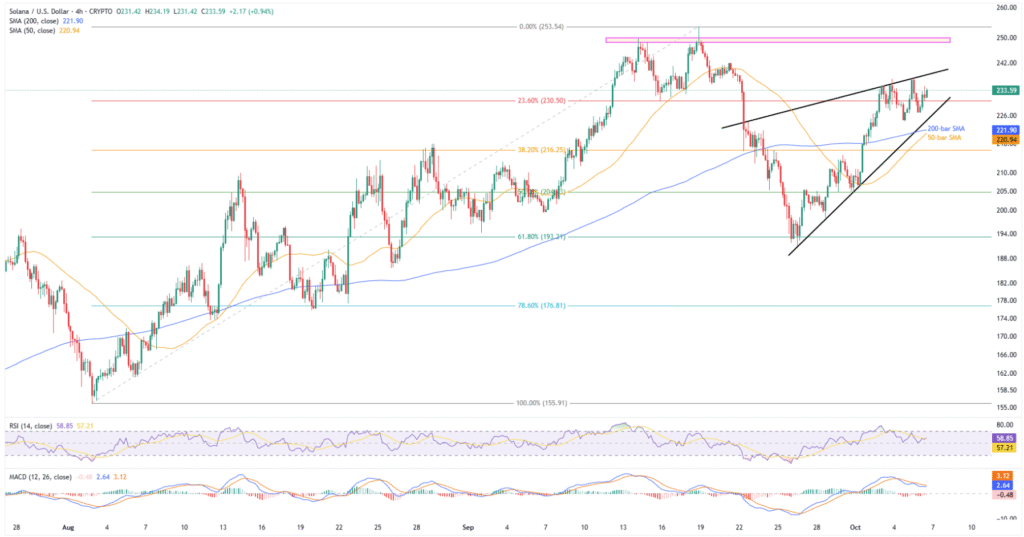
On the four-hour chart, Solana’s sustained trading within the triangle, backed by bullish momentum indicators, gains support from the quote’s placement above the 200-bar and 50-bar SMAs to keep buyers optimistic.
However, a three-week-old horizontal resistance area surrounding $248.00-$250.00 can act as an extra filter towards the north before highlighting the daily chart’s higher levels.
On the flip side, the 200-bar and 50-bar SMA levels, respectively near $222.00 and $220.90, could test the SOL bears past $224.00 support, a break of which could direct them to the deeper levels highlighted on the daily chart.
Conclusion
Solana’s price action supports a bullish outlook, fueled by strong momentum indicators and an SMA breakout. However, a short-term consolidation risk remains within the $239-$224 range, comprising the triangle formation.
Notably, SOL’s clear downside break of $193.00 could challenge the altcoin’s medium-to-long-term bullish bias, despite strong fundamental catalysts, making it crucial for traders to watch.


