- Solana price hits a two-week low after its biggest daily drop in a month, paring intraday losses of late.
- Downside break of short-term key support joins bearish signals from DMI and MACD to lure SOL bears.
- 100-day EMA and multi-week support trendline form a tough barrier for Solana sellers, while recovery remains elusive below $224.
- Short-term downside expected, but broad bullish trend is likely to hold.
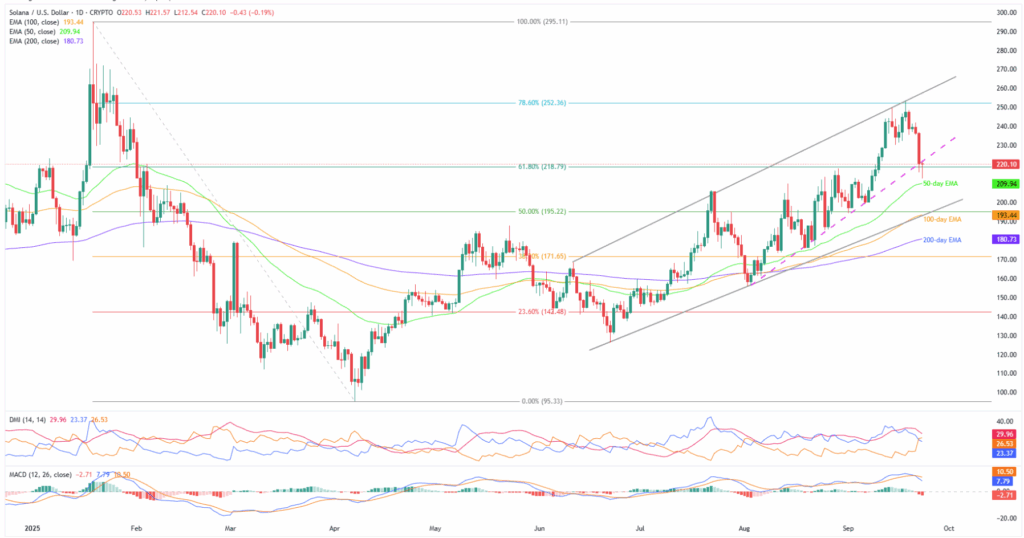
Solana (SOL) price slid to a two-week low early Tuesday, before bouncing back to $220.00 by press time, as it struggled near key support-turned-resistance after its biggest daily drop in a month.
Also read: Why is Crypto Falling Today? BTC falls 3%, ETH slips 7%, XRP down 6%
Despite the SOL’s corrective bounce, a sustained downside break of a seven-week-old trendline support and bearish signals from momentum indicators, such as the Directional Movement Index (DMI) and Moving Average Convergence Divergence (MACD), keep bears hopeful.
Adding strength to the bearish bias is a strong trading volume and downbeat market capitalization (market cap). According to Santiment, Solana’s daily trading volume remains sturdy around $9.94 billion, after rising to more than a week’s high the previous day, showing upbeat trader participation. That said, the market cap drops to the lowest level since September 09, close to $119.21 billion as we write.
Still, a convergence of the 100-day Exponential Moving Average (EMA) and a three-month rising trend line defends the altcoin’s broad bullish trend.
Solana Price: Daily Chart Keeps Buyers Hopeful Beyond $193

Solana’s clear breakdown of an ascending support line from early August, now immediate resistance near $224.00, joins the bearish MACD signals (Red) and downbeat DMI clues to keep sellers hopeful despite the latest rebound from a fortnight’s low.
The DMI’s Downmove (D-, Orange) line jumps past the 25.00 neutral level and crosses the D+ (Upmove, Blue) line, signalling bearish momentum. The downside bias is further strengthened by an elevated ADX (Average Directional Index, Red) line near 30.00.
With this, the SOL sellers set their sights on the 50-day EMA support of $209.90. However, the 100-day EMA joins an ascending trend line from late June to highlight $193.00 as a tough nut to crack for the bears before taking control.
If Solana bears break the $193.00 key support, the 200-day EMA at $180.00 will be the last defense for buyers. A break below this could target the previous monthly low near $155.00, June’s low around $126.00, and the yearly bottom near $95.00.
On the contrary, a daily closing beyond the $224 immediate hurdle, previous support, could lure buyers toward the $230.00 threshold, before approaching a nine-week resistance surrounding $257.00.
Beyond that, multiple top marks in January around $273.00 and the yearly peak of $295.11, quickly followed by the $300.00 psychological magnet, could flash on the SOL bull’s radar.
Solana Price: Four-Hour Chart Points To Short-Term Bearish Bias

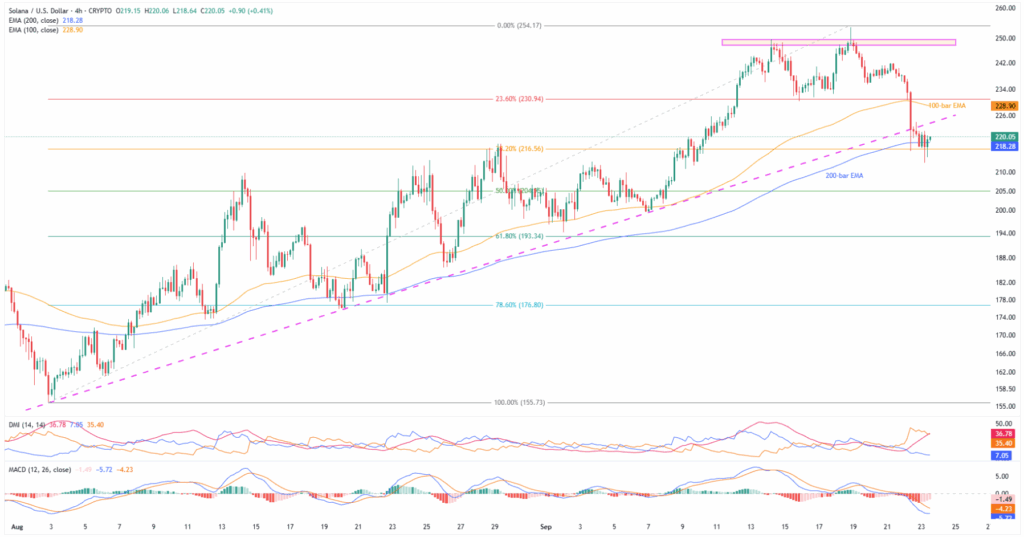
Solana bears appear to be more convinced on the four-hour chart, amid stronger bearish MACD and DMI signals, even as the 200-bar EMA clutches the prices around $218.00-$2,19.00.
The MACD signals continue the bearish momentum from Friday, with the DMI’s Downmove (D-, Orange) line and the ADX (Average Directional Index, Red) line both well past the 25.00 neutral level, currently above 30.00, indicating strong downside momentum. Meanwhile, the D+ (Upmove, Blue) line remains weak, at its lowest since early August, showing minimal recovery bias.
With this, the SOL bears are likely to hit a fresh low, which in turn highlights the 50% and 61.8% Fibonacci retracements of its August-September upside, respectively near $205.00 and $193.00, as the key support.
As mentioned earlier, the altcoin’s downside break of $193.00 could make it vulnerable to approach the yearly bottom, with intermediate halts discussed on the daily chart.
Alternatively, the support-turned-resistance of $224 precedes the 100-bar EMA of $229 to restrict short-term SOL recovery.
Beyond that, a week-long horizontal resistance region surrounding $247.00-$250.00 could stop the bulls before directing them to the daily chart’s higher levels.
Conclusion
Solana’s latest bearish breakdown lures short-term sellers within the broader bullish range, currently between $193.00 and $257.00. That said, the momentum indicators are also turning increasingly bearish, and hence the risk of a deeper decline toward the $193.00 support is rising. A clear downside break of the $193.00 support level could challenge Solana’s medium-to-long-term bullish bias, despite strong fundamental catalysts. With this, the SOL traders should closely monitor $193.00 and momentum shifts for signs of potential further downside or a reversal.
Also read: Cryptocurrency Weekly Price Prediction: BTC Holds, But ETH & XRP Dip as Dollar Edges Up


