- Solana price pulls back after weekend surge, defending two-week downtrend.
- Bearish momentum indicators and “death cross” on the four-hour chart lure SOL sellers.
- Convergence of 100-day EMA and “Bullish Megaphone” bottom guard broad recovery trend.
- Short-term pullback to $195.00 likely, but bullish trend needs $230.00 break to gain strength.
Solana (SOL) price drops over 1.0% to $208.00 early Monday as traders consolidate the previous day’s gains, following a two-week downtrend.
Solana (SOL) pulls back as market uncertainty lingers ahead of key U.S. employment data. However, discussions around a proposal to increase transaction capacity in each block, while allowing developers to do more on the network, test SOL sellers pause amidst a cautious mood.
Also read: Firedancer Proposes Removing Solana Compute Unit Block Limit
The altcoin’s pullback gains credibility from strong trading volume and a decline in market capitalization (market cap). According to Santiment, Solana’s (SOL) daily trading volume has climbed for the second consecutive day, reaching a three-day high of $5.06 billion, signaling strong interest from traders. That said, the market cap pulls back from its highest since Wednesday, settling at $113.35 billion.
Notably, a sustained break below a seven-week trendline support, along with bearish signals from momentum indicators like the Directional Movement Index (DMI) and Moving Average Convergence Divergence (MACD), keeps bears hopeful for further declines.
Still, a convergence of the 100-day Exponential Moving Average (EMA) and a three-month rising trend line, forming part of the “bullish megaphone” trend-widening formation, defends the altcoin’s broad upside outlook.
Solana Price: Daily Chart Keeps Buyers Hopeful Beyond $195

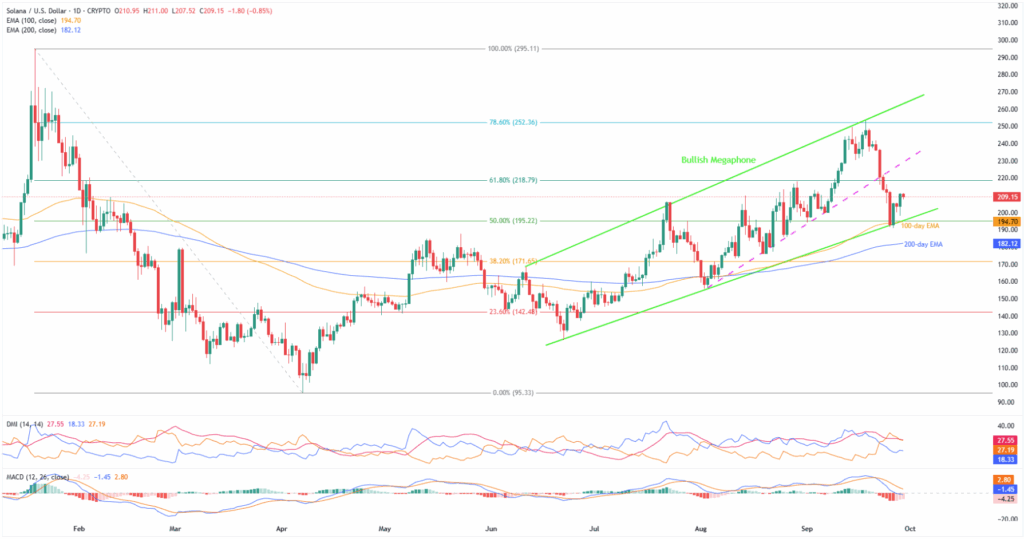
Solana’s previous weekly drop beneath an ascending support line from August, now turned resistance at $230, is backed by bearish MACD and DMI signals, keeping short-term sellers hopeful. However, a strong “bullish megaphone” pattern, in place since June, still supports buyers, unless the SOL falls below the critical $195 support. Adding to this, the 100-day EMA reinforces that support, making it a key level to watch.
The MACD histograms are very much red and portray the bearish momentum. On the same line, the DMI’s Downmove (D-, Orange) line stays firmer past the 25.00 neutral level, as well as the D+ (Upmove, Blue) line, signalling bearish momentum. The downside bias is further strengthened by an elevated ADX (Average Directional Index, Red) line near 27.00.
With this, SOL looks poised to revisit the $195.00 support confluence, comprising the “bullish megaphone” bottom line and the 100-day EMA. That said, the $200.00 threshold can offer immediate support to the quote.
If Solana bears break the $195.00 key support, the 200-day EMA at $182.00 will be the last defense for buyers. A break below this could make the SOL vulnerable to slump toward the previous monthly low near $155.00, June’s low around $126.00, and the yearly bottom near $95.00.
On the contrary, a daily closing beyond the $230.00 immediate hurdle, previous support line, could direct buyers toward the top of the aforementioned trend-widening formation surrounding $264.00.
Notably, the 78.6% Fibonacci retracement of Solana’s January-April downturn, close to $252.00, can act as an additional upside filter between $230.00 and $264.00.
Beyond that, multiple top marks in January around $273.00 and the yearly peak of $295.11, quickly followed by the $300.00 psychological magnet, could flash on the SOL bull’s radar.
Solana Price: Four-Hour Chart Highlights “Death Cross”

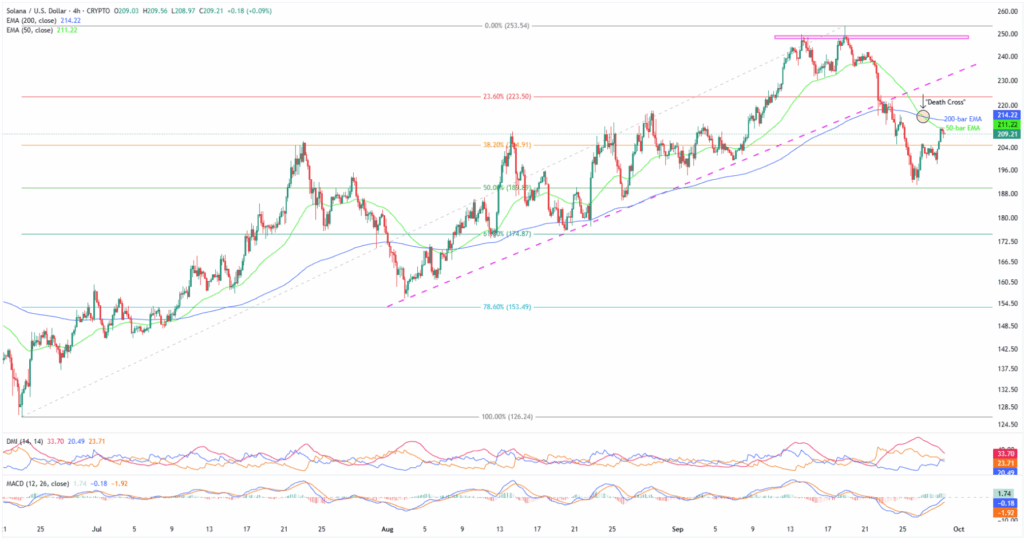
On the four-hour chart, Solana bears are gaining confidence, with a “Death Cross” signaling further downside. This occurs when the 50-bar EMA crosses below the 200-bar EMA, typically a signal for sellers to take control.
With this, the SOL sellers appear well-set to approach the 38.2% and 50% Fibonacci retracements of the altcoin’s June-September upside, respectively, near $204.00 and $189.00.
Below that, deeper levels discussed on the daily chart will gain the market’s attention.
Alternatively, the 50-bar and 200-bar EMAs, close to $211.00 and $214.00 in that order, restrict short-term Solana recovery before the multi-week support-turned-resistance surrounding $230.00.
Should the SOL buyers manage to keep the reins past $230.000, a fortnight-old horizontal resistance area, near $248.00-$250.00, could act as an intermediate halt before the daily chart’s higher levels.
Conclusion
Solana’s latest bearish breakdown lures short-term sellers within the broader bullish range, currently between $195.00 and $264.00. That said, the momentum indicators are also turning increasingly bearish, and hence the risk of a deeper decline toward the $195.00 support is rising.
Notably, SOL’s clear downside break of $195.00 could challenge the altcoin’s medium-to-long-term bullish bias, despite strong fundamental catalysts, making it crucial for traders to watch.
Also read: Crypto Weekly Price Prediction: BTC, ETH & XRP all Tumble as U.S. Data Fuels Dollar, NFP Eyed


