- Solana price snaps three-day winning streak, pulling back from a two-week resistance.
- Sustained recovery from $175.00 support confluence, multi-month bullish channel keeps SOL buyers optimistic despite latest retreat.
- DMI and MACD momentum indicators look sluggish, highlighting Solana’s need for a strong fundamental catalyst to propel recovery.
- Short-term potential pullback could test the broad bullish trend if SOL price breaks $175.00 support.
Solana (SOL) posts the first daily loss in three by falling to $185.00 early Tuesday, reversing the previous rebound from a crucial support within a multi-month bullish channel. The SOL’s latest retreat takes clues from the broad crypto market consolidation.
In doing so, the altcoin takes a U-turn from a two-week descending trendline resistance despite sluggish momentum indicators like Directional Movement Index (DMI) and Moving Average Convergence Divergence (MACD).
Notably, a pullback in the trading volume and market capitalization (market cap) raises doubts about the quote’s latest weakness, suggesting a recovery in prices. According to Santiment, Solana’s daily trading volume retreats from a three-day high of $5.74 billion, whereas the market cap pulls back to $101.17 billion as we write.
Overall, Solana’s consistent trading within a bullish channel since March, combined with a decisive rebound from the 200-day Simple Moving Average (SMA), suggests a sustained short-term recovery while aligning with the broader bullish momentum.
Solana Price: Daily Chart Keeps Buyers Hopeful Beyond $175

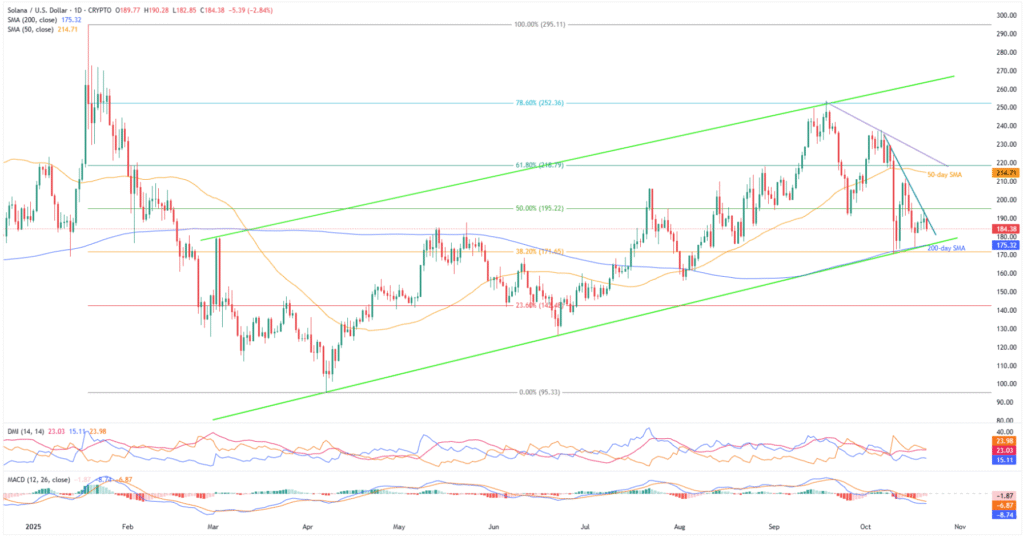
Solana’s clear reversal from a convergence of the 200-day SMA and bottom line of an ascending trend channel since March, close to $175.00 by press time, lacks support from momentum oscillators, which in turn adds strength to the immediate resistance line.
The MACD signals are still bearish (red histograms), despite lacking strength, while the positioning of multiple lines within the DMI momentum indicator also lures the short-term SOL sellers.
That said, the DMI’s Downmove (D-, Orange) line tops the ADX (Average Directional Index, Red) line and the D+ (Upmove, Blue) line, as well as stays closer to the 25.00 neutral level, which in turn suggests the presence of bearish momentum.
This highlights the need for a fundamental push to overcome a two-week resistance line surrounding $191.00, while keeping eyes on the $175.00 support confluence for potential downturn.
The Altcoin’s sustained failure to cross the $191.00 hurdle could drag it back to the $175.00 support confluence, comprising the 200-day SMA and stated bullish channel’s bottom.
During the quote’s daily closing below $175.00, a 38.2% Fibonacci ratio near $171.50 could test the bears before giving them control.
Notably, Solana’s daily closing beneath $171.50 makes it vulnerable to slump toward lows marked in August and June, close to $155.80 and $126.10 in that order, before approaching the $100 threshold and the yearly bottom surrounding $95.30.
Alternatively, the SOL’s run-up beyond $191.00 hurdle needs validation from the $200.00 threshold and the 50-day SMA hurdle of $215.00, ahead of a month-long resistance line near $225.00.
Should the quote remain firmer past $225.00, the 78.6% Fibonacci retracement of its January-April fall, near $252.50, and the aforementioned bullish channel’s top near $265.00, could lure the SOL bulls.
Solana Price: Four-Hour Chart Points To Receding Bearish Bias

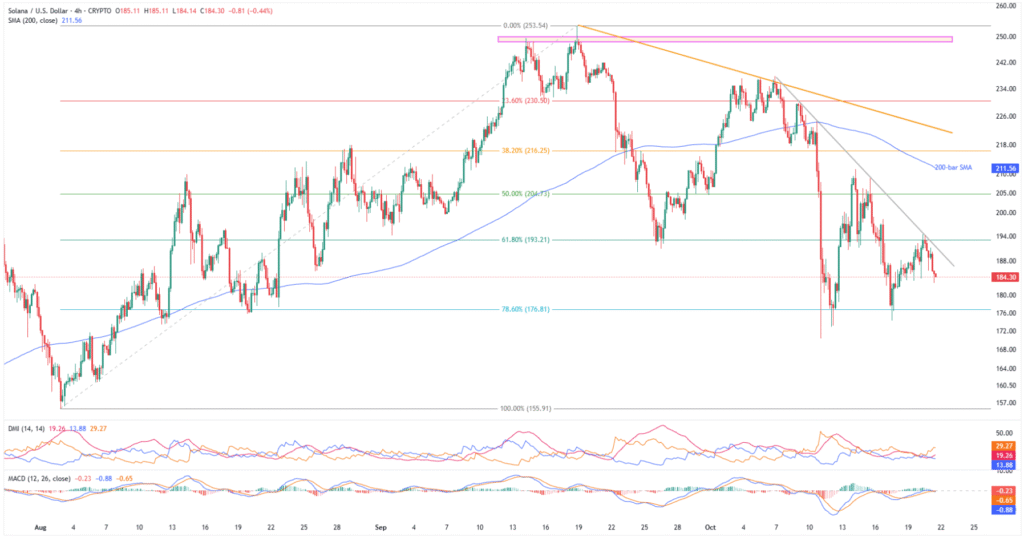
On the four-hour chart, Solana fades recovery from the 78.6% Fibonacci retracement of its August-September upside. The SOL pullback also takes clues from the DMI signals, which are bearish, but the MACD signals are mixed, portraying the trader’s dilemma.
Still, the short-term sellers are slightly optimistic as long as the prices stay beneath the immediate two-week resistance surrounding $191.00.
With this, the SOL sellers are approaching the 78.6% Fibonacci retracement level of $176.81.
If Solana bears keep the reins past $176.00, August’s low of $155.91 and deeper levels discussed on the daily chart will gain the market’s attention.
On the contrary, if the SOL buyers manage to keep control past $195.00, they can aim for the 50% Fibonacci ratio of $204.80 and then the 200-bar SMA hurdle of $211.60.
After that, a month-old resistance line near $224 and a four-week horizontal area surrounding $248.00-$250.00, as well as the previous monthly high of $253.49, may test the SOL bulls before directing them to the daily chart’s higher levels.
Conclusion
A broad crypto market consolidation contradicts Solana traders’ optimism to underpin short-term bearish bias about the altcoin. However, a sustained recovery from the $175.00 support confluence will defend the broad bullish strength. Additionally, a strong ecosystem and a multi-month bullish channel keep SOL buyers optimistic despite the quote’s recent struggle.
Also read: Top 5 Altcoins to Watch in October 2025


