- Solana price hits a three-day winning streak, approaching weekly high inside a multi-week “Bullish Megaphone”.
- Crypto market optimism post FOMC Interest Rate Decision helps SOL extend its early-month bullish breakout.
- The top of the trend-widening formation and upper Bollinger Band could test SOL bulls amid overheated DMI.
- Pullback may aim for $224.00, but the 200-day SMA offers ultimate support to defend bullish bias.
- Multiple hurdles near $273.00 could test Solana buyers passed $255, before challenging the yearly peak.
Solana (SOL) price climbs for the third day straight to $246.80 on Thursday, fueled by rising crypto market optimism following the U.S. Federal Reserve (Fed) Interest Rate Decision.
The altcoin’s bullish performance also takes clues from news that the U.S. Securities and Exchange Commission (SEC) gained the required votes to relax rules for approving crypto Exchange-Traded Funds (ETFs) applications.
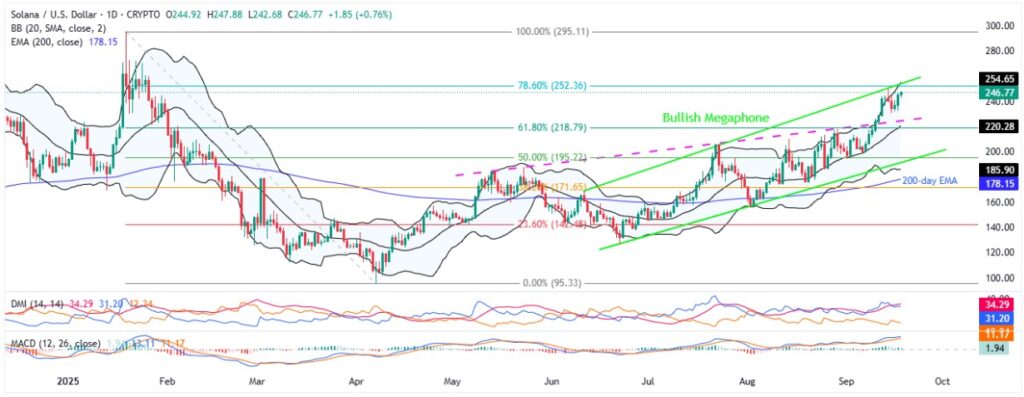
Furthermore, Solana’s previous breakout of a multi-month trendline resistance, now support, joins bullish signals from the Moving Average Convergence Divergence (MACD) momentum indicator to keep buyers hopeful within a three-month “Bullish Megaphone” trend-widening chart formation.
Additionally, strong trading volume and upbeat market capitalization (market cap), also reinforce bullish bias about the SOL coin.
According to Santiment, Solana’s daily trading volume hits a week’s high of $10.85 billion, whereas the market cap also posts a record high of $134.00 billion.
Despite the overall bullish trend, overbought signals from the Directional Movement Index (DMI) and multiple strong resistance levels may challenge Solana’s short-term buyers.

Solana Price: Daily Chart Suggests Short-term Consolidation
Solana bulls cheer a four-month resistance breakout within a trend-widening formation since June.
Further, the Sol’s upside bias takes clues amid bullish MACD signals and broader crypto market optimism.
However, a convergence of the upper Bollinger Band (BB) and the bullish megaphone’s top together highlights $255.00 as the short-term key resistance, especially amid the overheated DMI signals.
That said, the DMI’s ADX (Average Directional Index, red) and the D+ (Upmove, blue) line are both way beyond the 25.00 neutral level, suggesting overheated bullish momentum. Even so, the D+ (Upmove, blue) line is at the bottom with a 12.00 reading, suggesting very weak downside bias.
With this, the SOL prices may dribble around $255.00 for a while before posting the next rally, possibly targeting multiple top marks in January around $273.00 and the yearly peak of $295.11, quickly followed by the $300.00 threshold.
Meanwhile, Solana’s fresh pullback may aim for the weekly low of around $230.00, but the buyers can remain hopeful unless the price drops beneath the resistance-turned-support line, close to $224.00.
Below that, the middle BB of $220.00, the 50% Fibonacci retracement of its January-April fall, close to $195.00, and the lower boundary of the trend-widening formation, near $190.00, could lure the SOL bears.
Notably, Solana’s overall bullish trend remains intact beyond the lower BB of $185.00, with the 200-day Exponential Moving Average (EMA) of $178.00 acting as the last line of defense for the buyers.
Solana Price: Four-Hour Chart Suggests Pullback

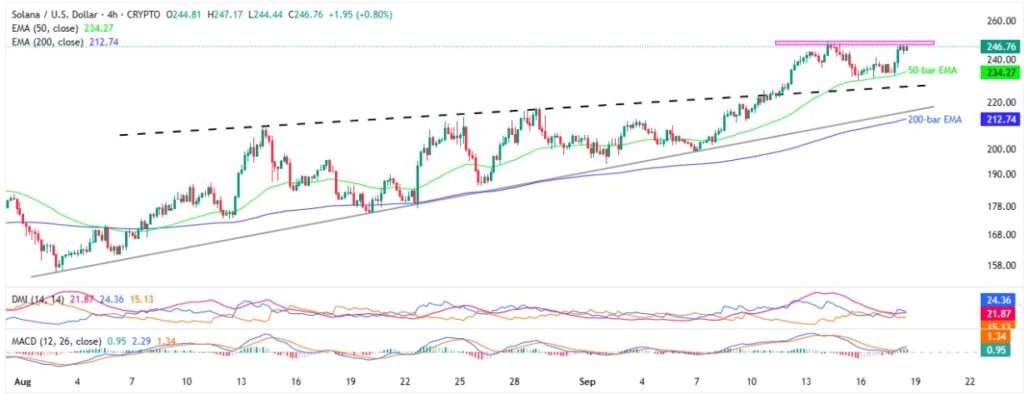
On the four-hour chart, weekly horizontal resistance near $248.00-$250.00 could test the buyers.
Notably, the DMI conditions aren’t overheated on the four-hour chart, and the MACD is also comparatively more bullish than the daily projection, keeping short-term buyers hopeful.
However, a slew of upside hurdles past $250.00, discussed on the daily chart, could make SOL’s road toward the north long and bumpy.
On the flip side, the 50-EMA and previous resistance line from mid-August, respectively near $234.00 and $227.00, restrict short-term SOL downside.
Below that, a six-week-old ascending support line and the 200-bar EMA, respectively near $216.00 and $212.00, could act as the final defense of Solana buyers before highlighting deeper levels discussed on the daily chart.
Conclusion
Solana’s rally runs out of fuel as it approaches the key upside hurdles, suggesting a short-term pullback in prices. However, the bullish chart formation and early-month breakout, as well as the quote’s sustained trading beyond the key EMAs, keep the broader upside outlook intact.
Also read: Breaking News: Fed Chair Powell Cuts Interest Rate by 25 Basis Point, Bitcoin Consolidates


