- Stellar price reverses from 100-day SMA, snapping a two-day winning streak within a six-week descending triangle.
- Bullish setup, strong support levels, and weak Stochastic challenge XLM bears.
- A clear break above $0.4100 may end Stellar’s bearish consolidation since mid-July.
- XLM’s break below $0.3440 challenges the triangle pattern, but $0.3225 is critical for Stellar bears.
- Short-term consolidation likely, but overall bullish trend remains intact.
Stellar (XLM) faces its first daily loss in three, down 2.0% intraday to $0.3642 early Tuesday morning in New York.
The XLM’s latest fall could be linked to its reversal from the 100-day Simple Moving Average (SMA), which in turn gains support from the upbeat trading volume to lure bears.
However, a six-week descending triangle bullish chart set up and a nearly oversold Stochastic momentum indicator keep buyers hopeful.
Even if the quote defies the triangle formation, a convergence of the 200-day SMA and the key Fibonacci retracement level appears to be a tough nut to crack for the bears.
That said, Stellar’s daily trading volume remains sturdy near a four-day-high, despite retreating a bit to $247.64 million, whereas the market capitalization (market cap) eases to $11.62 billion by press time, according to Santiment.
With this, Stellar may face a short-term downside, but the overall bullish trend remains intact.
Stellar Price: Daily Chart Points To Limited Downside Room

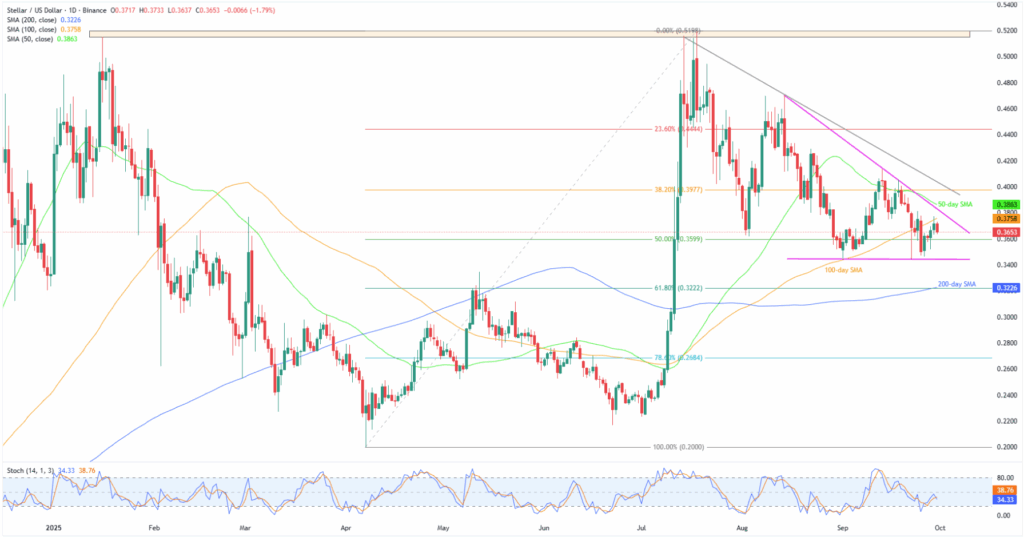
Stellar’s U-turn from the 100-day SMA hurdle of $0.3758 joins broad crypto market consolidation to direct sellers toward the 50% Fibonacci retracement of its April-July upside, near $0.3600.
However, the XLM’s price action since mid-August portrays a descending triangle bullish chart pattern, highlighting the $0.3440 support level for bears.
If Stellar slips below the $0.3440 support, a convergence of the 200-day SMA and the 61.8% Fibonacci retracement level, also known as the “Golden Fibonacci Ratio”, could offer the last fight to the bears around $0.3225-$0.3220.
Below that, XLM sellers may target the $0.3000 psychological level, June’s high at $0.2840, and the 78.6% Fibonacci at $0.2684 before heading toward the yearly low of $0.1999.
On the flip side, a daily closing beyond the 100-day SMA hurdle of $0.3758 would shift the market’s attention to the triangle’s top near $0.3830, to confirm the bullish chart setup. Also acting as a short-term key upside filter is the 50-day SMA resistance of $0.3865.
Should Stellar buyers keep reins past $0.3865, a descending resistance line from mid-July, around $0.4100, could challenge the upside toward the triangle breakout target of $0.5080.
Additionally, XLM bulls should watch $0.4000 and $0.5000 levels, along with the eight-month resistance zone between $0.5150–$0.5200, as key upside milestones.
Stellar Price: Four-Hour Chart Highlights Triangle Formation

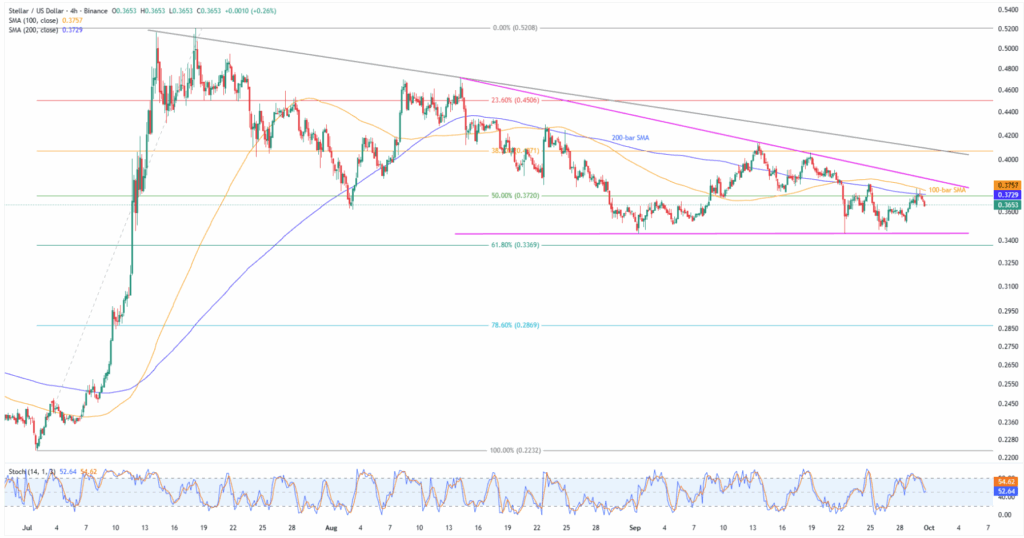
On the four-hour chart, the XLM reversal from the 200-bar and 100-bar SMAs, respectively near $0.3730 and $0.3760.
The pullback joins a downbeat, but not oversold, Stochastic to direct Stellar sellers toward the previously stated triangle’s support line surrounding $0.3440.
Herein, the 61.8% and 78.6% Fibonacci ratios of July’s upside, close to $0.3370 and $0.2870, act as additional downside filters past $0.3440, apart from the deeper levels discussed on the daily chart.
Alternatively, a clear break of the $0.3760 isn’t an open invitation to the XLM bulls as the triangle’s top and a descending trend line from July 14, close to $0.4100, will be crucial for buyers to retake control.
Conclusion
Stellar’s reversal from the 100-day SMA joins downbeat Stochastic to lure short-term sellers. Still, the multi-week bullish chart formation and nearly overheated momentum indicator keep the overall XLM outlook bullish.
Also read: Crypto Weekly Price Prediction: BTC, ETH & XRP all Tumble as U.S. Data Fuels Dollar, NFP Eyed


