- Stellar price rises to a fortnight high, up for third consecutive day.
- Clear bounce off 50-day EMA, upbeat RSI and looming bull cross on MACD favor XLM buyers.
- Short-term upside momentum strengthens, but multi-month trading range is likely to prevail as RSI approaches overbought territory.
Stellar (XLM) price jumps over 5.0% on a day to post a two-week high heading into Friday’s U.S. trading session, closing at close to $0.4650 by the press time.
In doing so, the XLM cheers the sustained trading beyond the key Exponential Moving Averages (EMAs) to print a three-day winning streak.
Adding strength to the upside bias are the upbeat conditions of the 14-day Relative Strength Index (RSI) and a potential bull cross forms on the Moving Average Convergence Divergence (MACD) indicator.
It should be noted that Stellar’s latest run-up gains support from trading volume as it jumps to a three-day high of $473.72 million, per the Santiment data. This also helps propel the XLM market cap to the highest level in two weeks, close to $13.71 billion at the latest.
Stellar Price: Daily Chart Favors Short-term Upside

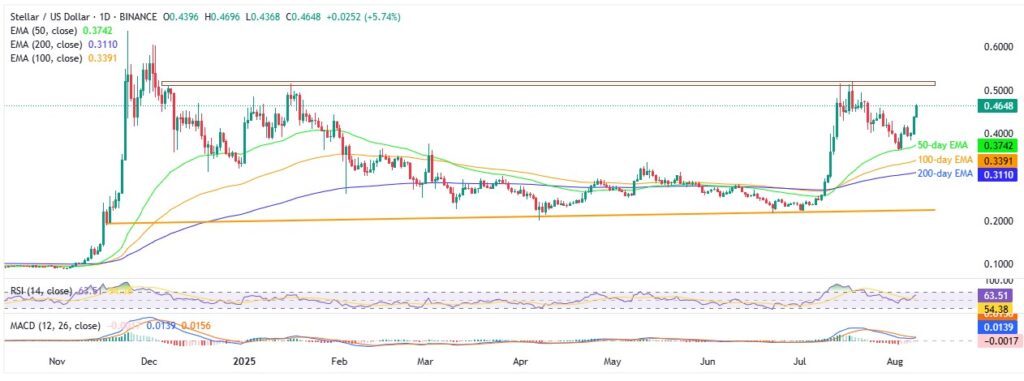
The XLM’s successful U-turn from the 50-day EMA joins the above 50.00 but not beyond 70.00 RSI conditions to suggest the quote’s further upside. This highlights an eight-month-old horizontal resistance area surrounding $0.5100-$0.5200 as the key resistance to watch for the buyers.
Should Stellar manage to cross the $0.5200, which is doubtful considering the RSI’s nearness to the 70.00 overbought limit, its run-up toward the December 2024 peak of $0.6060 and then to the previous yearly high of around $0.6375 can’t be ruled out.
Meanwhile, a downside break of the 50-day EMA support, currently around $0.3742, can drag the XLM price to the 100-day and 200-day EMAs, respectively, near $0.3390 and $0.3110.
However, an upward-sloping trend line from November 2024, near $0.2240, will be the last defense of the XLM buyers.
Stellar Price: Four-Hour Chart Backs Bullish Bias

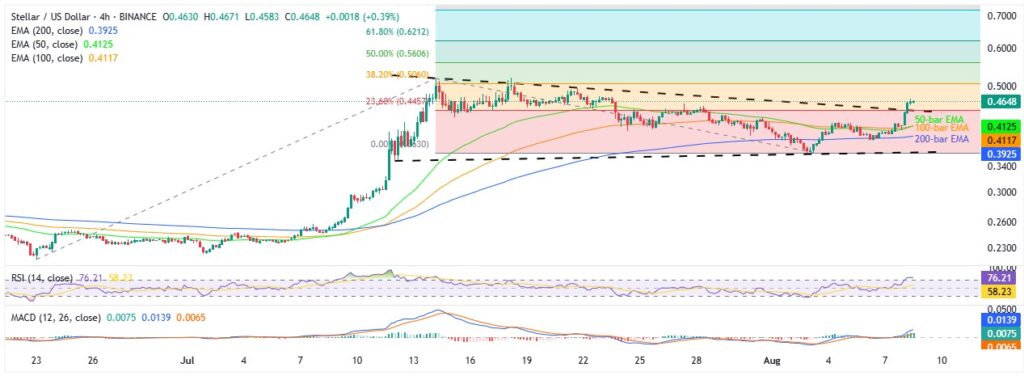
A month-old symmetrical triangle breakout joins the bullish MACD signals to favor the XLM buyers on the four-hour chart.
Still, the RSI’s overbought conditions suggest a slow grind toward July’s high of $0.5160.
Following that, the 50% and 61.8% Fibonacci Extensions of the quote’s June-August rise, respectively near $0.5610 and $0.6215, could lure the Stellar buyers before directing them to the daily chart levels.
Alternatively, the stated triangle’s top line, close to $0.4450, serves as an immediate support to watch during the XLM’s pullback.
Also important is the convergence of the 50-bar and 100-bar EMAs surrounding $0.4115-25.
In a case where the Stellar price drops beneath $0.4115, the 200-bar EMA and the aforementioned triangle’s bottom line, around $0.3920 and $0.3650 in that order, will be the last defense of the buyers.
Conclusion
Stellar builds short-term upside momentum within its multi-month range, but a breakout above $0.5200 is essential to unlock a move toward the 2024 high.


