- Stellar price fades to bounce off 100-day SMA, snaps two-day winning streak.
- XLM eases from a three-week falling wedge’s top as weak momentum stalls bullish attempts.
- Stellar buyers remain hopeful for successful trades above key SMAs and optimistic about the Whisk upgrade.
- XLM buyers face several hurdles to the upside, but the overall bullish trend remains intact.
Stellar (XLM) price takes a U-turn after hitting a weekly top, down 0.95% intraday near $0.3635 heading into Wednesday’s U.S. trading session.
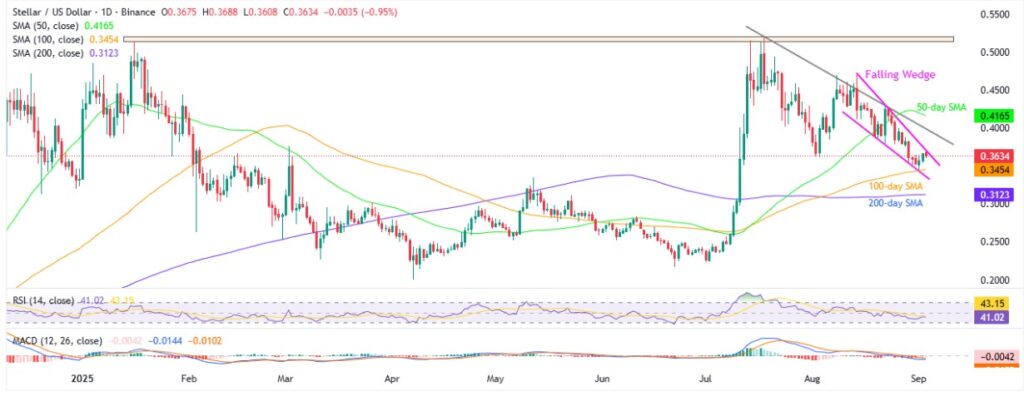
The XLM’s recent pullback could be tied to its failure to confirm a three-week-old falling wedge bullish chart pattern, with price action reversing from the pattern’s upper boundary. The trader’s hesitation comes as momentum indicators show limited bullish strength, specifically, the 14-day Relative Strength Index (RSI) and the Moving Average Convergence Divergence (MACD).
Adding to the bearish pressure is the declining trading volume and a dip in market capitalization. Stellar’s daily volume has eased to $280.52 million, marking its second straight day of decline, while the total market cap has pulled back to $11.49 billion, according to Santiment.
Despite recent setbacks, XLM buyers remain optimistic thanks to its successful trading above the key Simple Moving Averages (SMAs) and anticipation around the upcoming Stellar Protocol 23 upgrade, known as Whisk. The stated network upgrade is set for a mainnet vote on Wednesday at 17:00 GMT. If approved by the validators, the Whisk will be launched on the network, promising faster transactions with lower fees.
For more news details, check out our Crypto Bytes.
Stellar Price: Daily Chart Favors Short-term Upside

The XLM’s sustained trading past the 100-day and 200-day SMAs, combined with excitement around the Whisk upgrade, fuels buyer optimism—especially amid the presence of a three-week “Falling Wedge” bullish pattern.
Notably, the 14-day RSI line stays below the neutral 50.0 mark, and the MACD signals are mixed, recently teasing a bullish crossover, suggesting that the anticipated bullish breakout might be delayed longer than expected.
However, a clear upside break of the $0.3700 hurdle comprising the wedge’s top will confirm the XLM’s bullish trajectory toward the $0.5000 theoretical target.
During the anticipated rise, a descending resistance line from mid-July, around the $0.4000 mark, will precede the 50-day SMA hurdle of $0.4165 to challenge the XLM bulls.
Additionally, Stellar bulls face resistance at multiple tops around $0.4700, with a key horizontal zone near $0.5150-$0.5200, covering January highs and August peaks, acting as major hurdles to watch.
On the downside, the 100-day SMA at $0.3454 serves as the first support to watch, and a break below this could push XLM toward the falling wedge’s lower boundary around $0.3360.
It’s important to note that if Stellar falls below $0.3360, it would break the bullish chart pattern and likely push sellers toward the 200-day SMA support at $0.3123, with further downside targets at the $0.3000 level and June’s low near $0.2170.
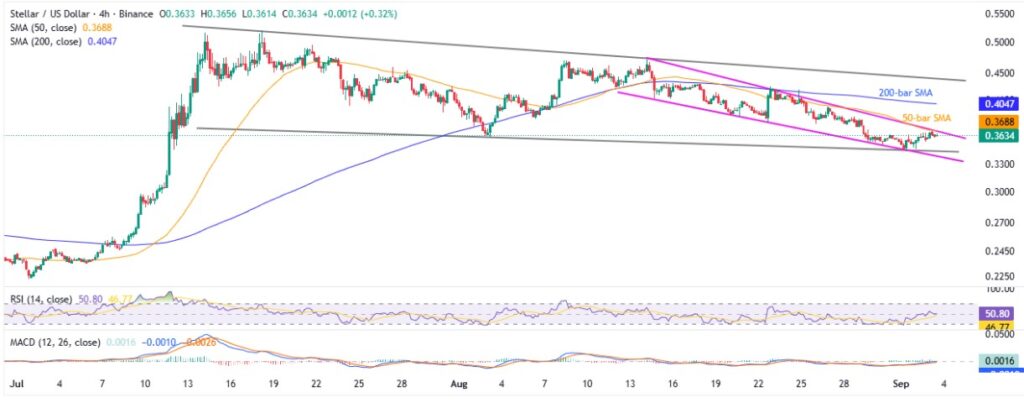
Stellar Price: Four-Hour Chart Piques Trader’s Interest

Despite retreating from a short-term falling wedge, the XLM price remains within a descending trend channel formation established since July.
Also important to note is that the 50-bar SMA adds strength to the $0.3700 upside hurdle, whereas the RSI line flashes bullish signals by staying firmer past the 50.00 neutral threshold. Additionally, the MACD signals are too sluggish on the shorter timeframe.
With this, the stated bearish channel’s bottom, close to $0.3430, acts as an additional downside filter for the short-term traders to watch, apart from the daily chart levels.
On the upside, the 200-bar SMA and the bearish channel’s top, respectively near $0.4050 and $0.4420, can offer additional hardships to the Stellar buyers, a break of which will shift the market’s attention to the higher levels discussed on the daily chart.
Conclusion
Stellar builds a short-term upside momentum within its consolidation since late July, but a breakout above $0.3700 is essential to unlock a move toward the 2024 high. That said, the overall bullish outlook holds.
Also read: Market Digest: Bitcoin Rises to 111K as Tariff Court Ruling and UK Fiscal Worries Rattle Markets


