- Sui price hits a five-week high, about to confirm bullish chart formation during a three-day uptrend.
- An Inverse Head-and-Shoulders pattern and sustained trading above key SMAs keep SUI buyers optimistic.
- Overheated Stochastic makes $3.90 and $4.43 resistances crucial on the way to $4.71 theoretical target for inverse H&S.
- Sui buyers are well-placed to reverse yearly loss, though multiple hurdles may trigger intermediate pullbacks.
Sui (SUI) price extends three-day uptrend to a five-week high around $3.90 early Thursday morning in New York.
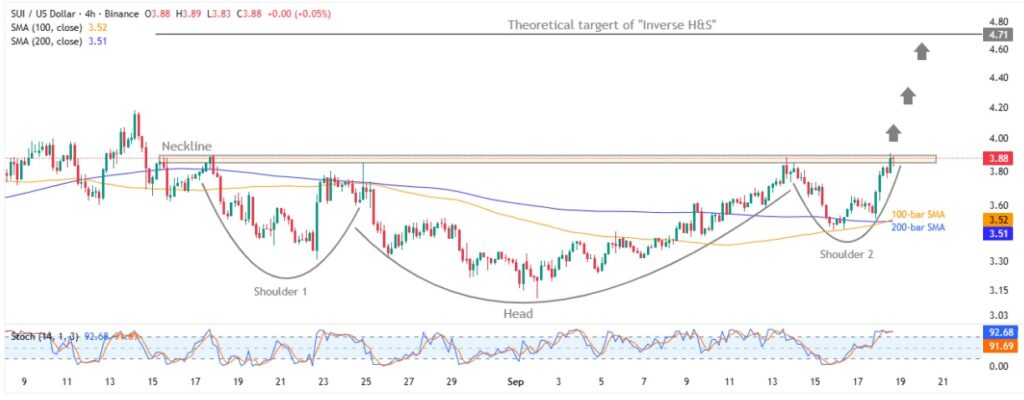
The altcoin’s latest run-up becomes interesting due to the existence of the inverse Head-and-Shoulders (H&S) bullish chart formation.
That said, SUI’s sustained trading beyond the key Simple Moving Averages (SMAs) joins the strong trading volume and upbeat market capitalization (market cap), as well as the crypto market optimism, to reinforce the bullish bias.
According to Santiment, Sui’s daily trading volume jumps to a four-week high of $1.95 billion, whereas the market cap rises to the highest level since August 13, close to $13.82 billion, by press time.
On Thursday, the crypto optimists cheer the U.S. Federal Reserve’s (Fed) interest rate cut, as well as clues for further dovish moves. Also adding to the positive sentiment were headlines from the U.S. Securities and Exchange Commission (SEC) suggesting easy rules for approving crypto Exchange-Traded Funds (ETFs) applications.
Also read: SEC Greenlights Crypto ETF Generic Listing Standards in Landmark Vote
Still, overheated conditions of the Stochastic momentum indicator and a slew of upside hurdles could offer intermediate halts during the SUI’s potential rally to reverse the yearly loss, currently around 5.0%.
SUI Price: Four-Hour Chart Highlights Inverse H&S Bullish Formation

SUI price holds Wednesday’s U-turn from the key SMAs, poking a Neckline of the inverse H&S bullish chart pattern, around $3.85-$3.90.
That said, the overheated Stochastic conditions, well beyond the 80.00 upper limit, make the $3.85-$3.90 resistance zone harder for the SUI bulls to cross.
Beyond that, the mid-August high of $4.18 could offer an intermediate halt during the rush toward a theoretical target of the inverse H&S, namely the $4.71 mark.
Alternatively, SUI’s pullback from the current level might not attract the bears unless the quote stays beyond a convergence of the 100-bar and 200-bar SMAs, close to $3.51-$3.52.
In a case where the quote’s consolidation extends past $3.51, the odds of witnessing a slump toward the monthly low of $3.11 can’t be ruled out.
SUI Price: Daily Chart Shows Bullish Consolidation

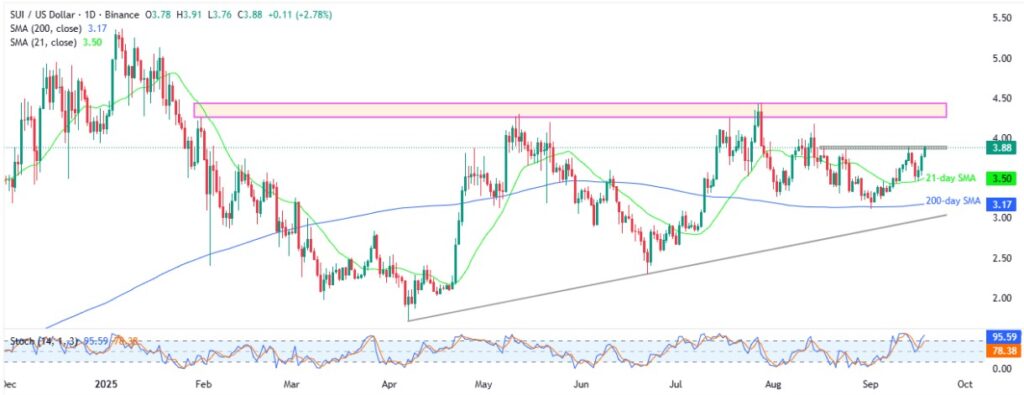
On the daily chart, Sui buyers cheer a sustained rebound from the 21-day SMA, but the Stochastic is overbought like the four-hour projection, making it harder for the bulls to cross the $3.85-$3.90 resistance zone.
Also acting as an upside filter is a broad resistance area ranging from January, between $4.26 and $4.44.
Beyond that, the inverse H&S target of $4.71, the $5.00 threshold, and the yearly high surrounding $5.37 could lure the bulls.
Alternatively, Sui’s fresh fall may aim for the 21-day SMA support of $3.50 before highlighting the 200-day SMA support of $3.17.
Above all, an ascending trend line from April, close to $2.98 by press time, acts as the final defense of the SUI buyers.
Conclusion
Sui’s sustained trading beyond key SMAs and the existence of a bullish chart formation favor the odds of witnessing a rally that could erase yearly losses. However, overheated momentum signals suggest the upside moves might be slow and could face several intermediate halts along the way.
Also read: Breaking News: Fed Chair Powell Cuts Interest Rate by 25 Basis Point, Bitcoin Consolidates


