- Tron price climbs to two-week high after four straight months of gains.
- TRX remains bullish above key EMAs, with MACD backing gains—even as RSI signals short-term heat.
- Seven-month resistance caps TRX/USD rally, but bears stay cautious above $0.2360.
Tron (TRX/USD) climbs to a two-week high near $0.2830 during Wednesday’s U.S. session, up over 1.0% on the day. The move extends TRX’s late-June rebound from its 100-day Exponential Moving Average (EMA), with bulls now eyeing a seven-month resistance zone that could unlock a run toward its late 2024 record high. Encouragingly, TRX continues to trade above key EMAs, while bullish momentum indicators support further upside. Let’s discuss details!
TRX/USD: Daily chart suggests further recovery

Source: TradingView
Tron’s sustained move above the 100-day and 200-day EMA combined with bullish Moving Average Convergence Divergence (MACD) signals and a strong but not overbought 14-day Relative Strength Index (RSI) near 60, keeps buyers hopeful.
However, the seven-month-old resistance zone between $0.2960 and $0.3100 remains a major hurdle. A break above $0.3100 could open the way toward the December 2024 record high near $0.4506, with $0.3500 and $0.4000 as possible intermediate targets.
On the downside, a pullback below the 100-day EMA at $0.2626 may push prices toward the 200-day EMA support at $0.2457, though bears are unlikely to dominate unless TRX falls below the upward-sloping resistance from late November 2024 near $0.2360.
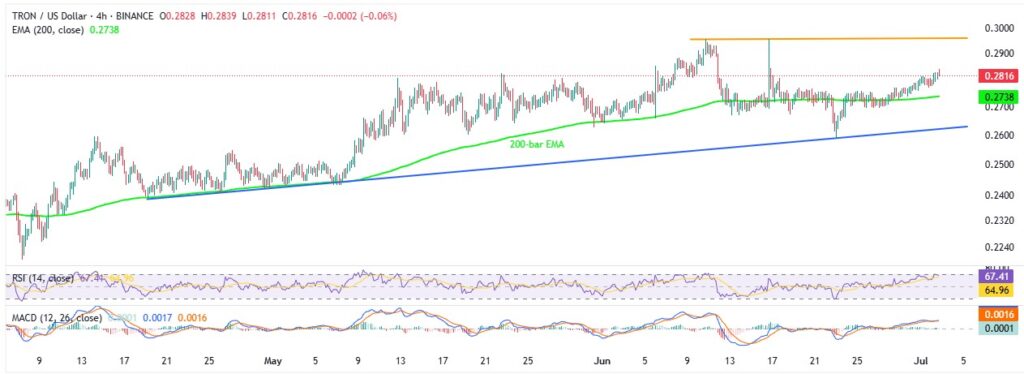
TRX/USD: Four-Hour chart highlights bearish channel

Source: TradingView
Unlike the daily chart, the four-hour chart shows an overbought RSI, above 70, signaling immediate risk to Tron’s upside momentum.
With this, the key support levels to watch are the 200-bar EMA at $0.2738 and an ascending trendline from April 19 near $0.2630. Further downside moves seem less likely but would point back to daily chart support levels.
Alternatively, the $0.2900 threshold is the first hurdle for the TRX/USD bulls before the “Double Tops” resistance around $0.2960, which must be broken to shift focus toward higher daily chart targets.
Overall, Tron is likely to continue its recent gains, but surpassing $0.2960 remains uncertain.


