- Tron price rebounds from multi-week bullish channel support, erasing Wednesday’s losses.
- 10-day EMA and double tops around $0.3710 can challenge TRX’s short-term recovery amid bearish MACD signals and steady RSI.
- Tron’s sustained trading above the 50-day EMA, and within a rising channel, keeps buyers hopeful for a fresh yearly top.
- Broad bullish trend holds despite possible intermediate pullbacks.
Tron (TRX) price rises 1.0% intraday to $0.3494 heading into Thursday’s U.S. trading session, bouncing off the 10-week ascending channel’s support to wipe out Wednesday’s losses.
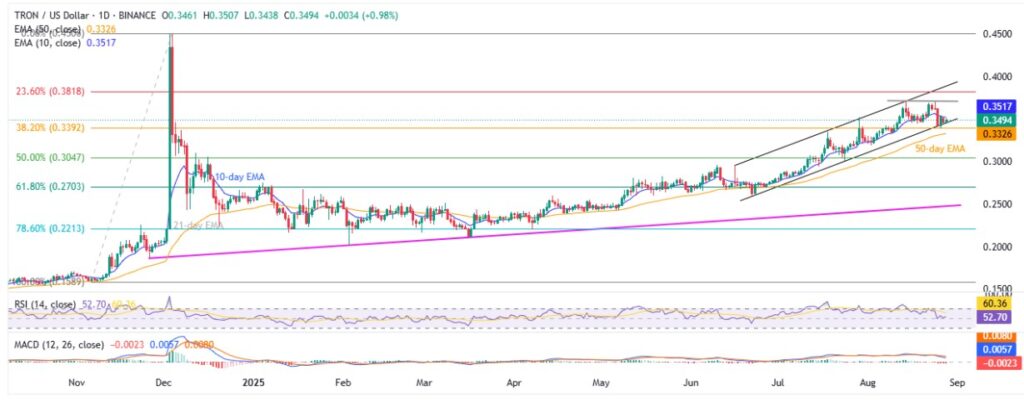
Mixed conditions of the momentum indicators challenge the Tron traders. That said, the neutral 14-day Relative Strength Index (RSI) supports TRX’s rebound from key support, though bearish signals from the Moving Average Convergence Divergence (MACD) and the immediate 10-day Exponential Moving Average (EMA) resistance continue to challenge short-term buyers.
Notably, declining trading volume in the last four consecutive days and an unimpressive rebound in the market capitalization also offer a mixed short-term outlook for the Tron traders. According to Santiment, the TRX’s daily trading volume drops to $984.15 million at the latest, the lowest in a week, while the market cap rebounds to $33.0 billion.
With this, the TRX’s broader bullish bias stays intact amid the presence of a multi-week rising channel and the quote’s sustained trading above the 50-day Exponential Moving Average (EMA), even as near-term hurdles can offer intermediate pullbacks in prices.
Tron Price: Daily Chart Highlights Immediate Hurdles For Bulls

Tron’s rebound from multi-week channel support faces resistance at the 10-day EMA near $0.3520, as bearish MACD signals and a steady RSI line cap the upside momentum.
Even if the quote manages to cross the $0.3520 resistance level, the double tops around $0.3710 will be a crucial challenge for the TRX buyers.
Following that, the Tron price can refresh its yearly high, targeting the 23.6% Fibonacci retracement of its late 2024 upside and the aforementioned bullish channel’s top, respectively near $0.3820 and $0.3900.
If TRX holds above $0.3900, the $0.4000 psychological level may slow the rally before targeting the late 2024 peak at $0.4506.
On the flip side, a daily closing beneath the stated channel’s lower boundary, near $0.3450, becomes necessary for the Tron sellers to take control. Even so, the 50-day EMA of $0.3326 will precede the 50% and 61.8% Fibonacci ratios, close to $0.3050 and $0.2700 in that order, to challenge the bears.
Overall, Tron’s bullish bias can prevail unless the quote drops below an upward-sloping support line from November 2024, surrounding $0.2470.
Tron Price: Four-Hour Chart Points To Short-Term Trading Range

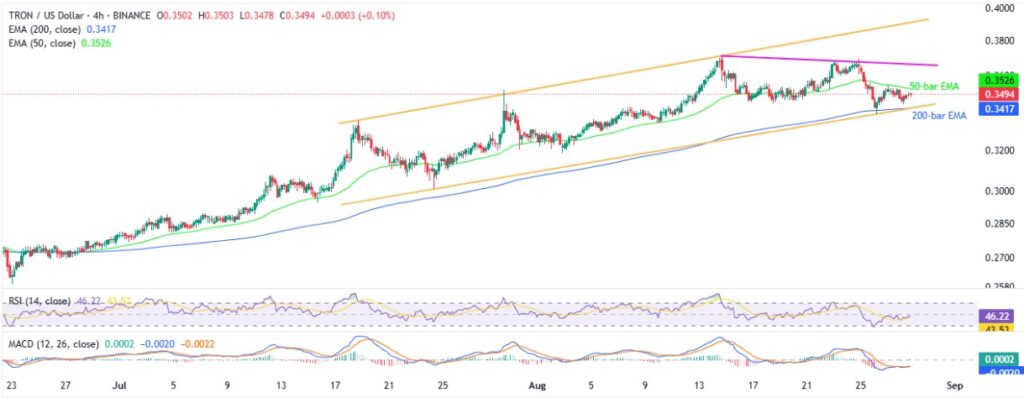
Tron’s four-hour chart highlights a short-term trading range between the 200-bar and the 50-bar EMAs within a six-week-old bullish channel. Also acting as an upside filter is the fortnight-old descending resistance line.
That said, the 200-bar EMA joins the stated channel’s bottom to suggest $0.3415 as the short-term key support. Below that, the monthly low of $0.3180 and the late July bottom of $0.3010 can gain the market’s attention before the daily chart levels.
Alternatively, a clear break of the 50-bar EMA hurdle, near $0.3525 at the latest, could fuel the TRX to a fortnight-old resistance line surrounding $0.3670.
Should the quote remain firmer past $0.3900, the stated bullish channel’s top around $0.3900 and the higher levels discussed on the daily chart will be on the bull’s radar.
Conclusion
Tron remains bullish as long as it holds above $0.3450. A break above $0.3710 could drive TRX toward $0.3900 and yearly highs. Below $0.3450, sellers may target $0.3326. A trader can expect some short-term volatility, but a broad upside bias stays intact.
Also read: What is Crypto Airdrop Farming? Learn How to Earn Free Cryptocurrency!


