- Tron struggles to extend bounce from 10-week low as 100-bar EMA caps bullish momentum
- 100-day EMA joins price-positive RSI and MACD signals to limit immediate downside.
- Multiple resistance levels stand in the way of TRX/USD upside.
- TRX bears need clear break below 200-day EMA to take back control.
Tron (TRX/USD) price fades bounce off 10-week low while posting mild losses near $0.2720 during Tuesday’s European session.
The TRX/USD pair recovered from the 100-day Exponential Moving Average (EMA) the previous day amid broad market optimism backed by the hopes of the Israel-Iran ceasefire. However, the 100-bar EMA on the four-hour chart joins the recently mixed geopolitical signals to challenge the quote’s further upside.
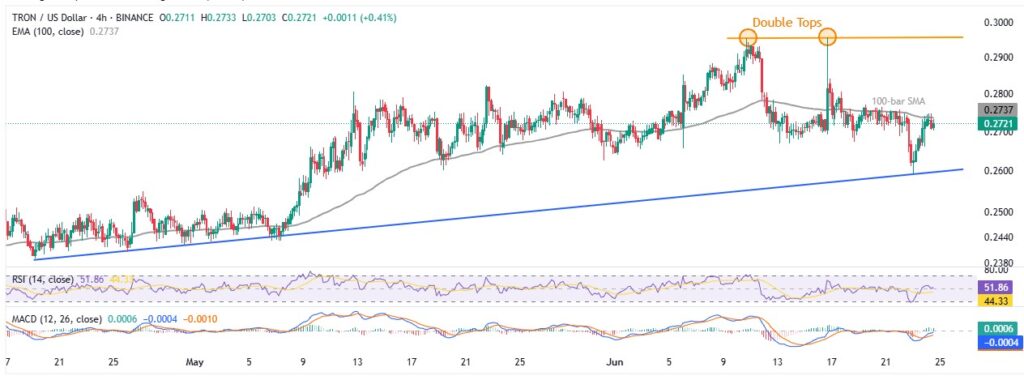
TRX/USD: Four-Hour chart identifies multiple hurdles to north

Source: Tradingview
Tron buyers face key resistance at the 100-bar EMA near $0.2740, but bigger hurdles loom with the “Double Tops” around $0.2960 and the psychological $0.3000 mark.
Additionally, the 14-bar RSI is bouncing back above 50 from near-oversold levels, while the MACD is flashing bullish signals—hinting at a possible further rally.
However, a pullback looks unlikely to break below the rising trendline from April 19, sitting close to $0.2600. Still, a quick drop toward the late April swing high near $0.2550 or even the mid-April low around $0.2400 remains possible if sellers take control.
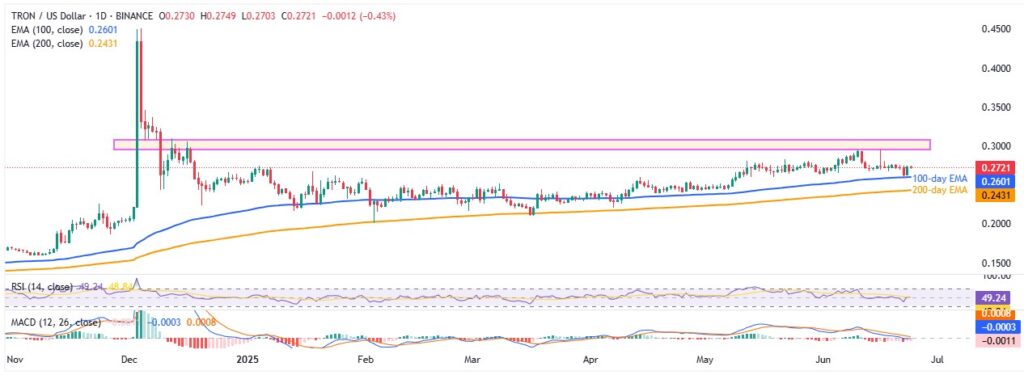
TRX/USD: Daily chart points to gradual run-up

Source: Tradingview
A solid bounce off the 100-day EMA, combined with the RSI holding near 50 and an upcoming bullish MACD crossover, signals strong upside momentum—even though the 100-bar EMA has recently tested TRX buyers on the four-hour chart.
However, Tron faces a tough resistance zone between $0.2960 and $0.3060, levels that have held since December 2024. Breaking through this area will be key for buyers to regain control.
On the downside, slipping below the 100-day EMA at $0.2600 could push TRX toward the 200-day EMA at $0.2430, which serves as the buyers’ last line of defense. A break below that might send the price tumbling toward the $0.2000 psychological level.
Overall, Tron’s recovery is losing steam, but buyers still have reasons to stay optimistic—for now.


