- TRON price defends weekend recovery from 21-day EMA within bullish channel.
- TRX stays above key EMAs within a bullish chart pattern, but RSI divergence may test rally hopes.
- Gradual run-up to refresh yearly top likely unless TRX/USD pair breaks $0.3150 support.
- A clear break of 0.2440 becomes necessary to give control back to the TRON bears.
TRON price (TRX/USD) renews its intraday high near $0.3300 early Monday, extending the weekend rebound from the key short-term Exponential Moving Average (EMA) within a bullish chart formation.
After five consecutive months of gains, TRX is on track for a second straight yearly rise and aims for a 2025 high within a seven-week-old bullish channel.
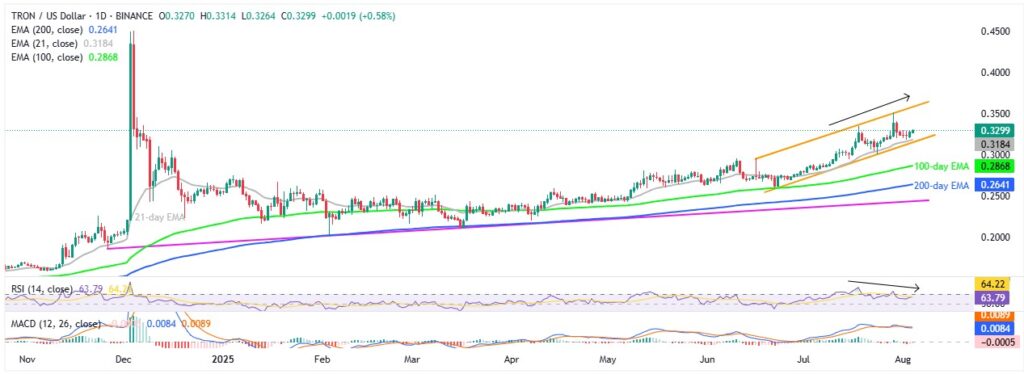
However, the last two price peaks show a bearish divergence with the 14-day Relative Strength Index (RSI), which could challenge the TRX/USD pair’s rally despite the price staying above key EMAs and the RSI holding above the 50.00 neutral level.
Still, a gradual run-up towards a new yearly high near $0.3520 appears highly expected.
TRON Price: Daily Chart Signals Gradual Run-up

A clear rebound from the 21-day EMA support, currently around $0.3180, joins a seven-week-old ascending trend channel to keep TRON buyers hopeful even if the RSI failed to back the last two peaks in the prices.
The Moving Average Convergence Divergence (MACD) indicator also flashes sluggish signals, suggesting a short-term pullback toward the 21-day EMA support of $0.3180.
A daily closing beneath the $0.3180 EMA support will highlight the stated channel’s bottom line, close to $0.3150; a break of the level could lure short-term TRX sellers to drive prices lower to the $0.3000 psychological magnet.
Even so, the 100-day and 200-day EMAs, respectively near $0.2865 and $0.2640, followed by an ascending trend line from November 2024, near $0.2440, will be tough nuts to crack before convincing the TRX/USD pair bears to retake control.
Alternatively, the $0.3400 threshold guards the immediate upside of the TRX before the yearly peak surrounding $0.3520. However, the bullish channel’s upper boundary surrounding $0.3600 will be a tough nut to crack for the bulls afterward, which, if ignored, enables prices to aim for the $0.4000 psychological magnet and then the previous yearly high of near $0.4500.
TRON Price: Four-Hour Chart Defends Buyers

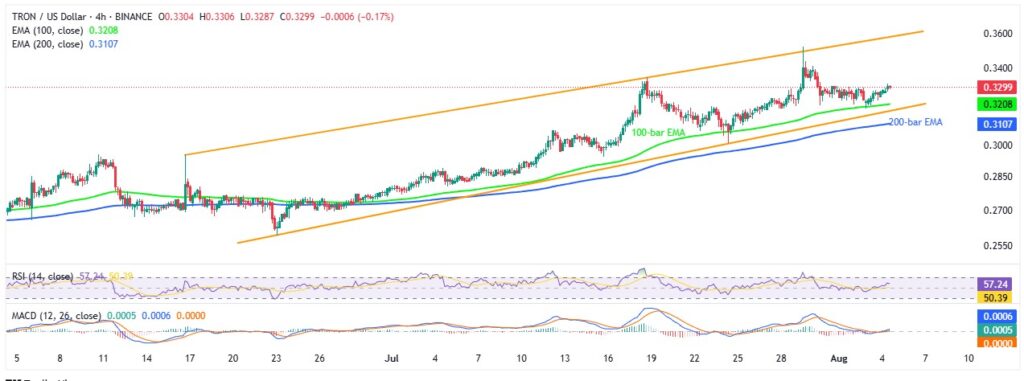
While the daily chart flags the RSI divergence to challenge the odds of witnessing a stellar run-up in the Tron prices, the four-hour chart appears more buyer-friendly due to upbeat RSI and MACD conditions.
As a result, the TRX/USD pair’s rise to the mid-July swing high surrounding $0.3350 becomes imminent before multiple hurdles, highlighting the $0.3400 and the yearly high of $0.3520 for the bulls. Following that, the higher levels of the daily chart will gain the market’s attention.
The formation of an ascending trend channel from mid-June, between $0.3600 and $0.3150, gains the TRON trader’s attention.
That said, the 100-bar EMA and 200-bar EMA, near the $0.3200 level and the $0.3100 zone, act as additional downside filters.
Conclusion
TRON (TRX/USD) price holds its bullish structure, keeping buyers hopeful. However, the bearish RSI divergence on the daily chart signals weakening momentum, limiting the chances of a strong breakout unless fresh upside confirmation emerges.
Also read: Cryptocurrency Weekly Price Prediction: BTC, ETH & XRP Cool Off After a Big Week


