- Tron jumps more than 7.0% intraday, crosses July 18 peak to refresh yearly high.
- Six-week resistance can test TRX bulls amid overbought RSI.
- Pullback remains elusive beyond $0.2950, rejection of adjacent resistance can highlight record top for TRX/USD bulls.
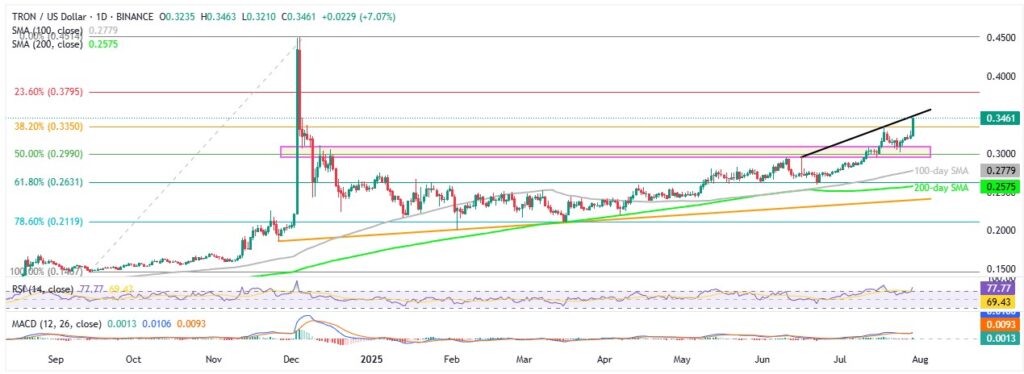
Tron price (TRX/USD) prices rise more than 7.0% intraday as bulls cheer upside break of the July 18 top to refresh yearly high around $0.3460 on Tuesday. In doing so, the TRX prices also justify sustained trading beyond the multi-month-old broad support zone and key Simple Moving Averages (SMA).
It’s worth noting that bullish signals from the Moving Average Convergence Divergence (MACD) indicator add strength to the TRX/USD pair’s latest upside, even as overbought conditions of the 14-day Relative Strength Index (RSI) highlight the importance of a six-week-old ascending trend line resistance for the buyers.
Tron: Daily Chart Keeps Buyers Hopeful

Looking at the TRX/USD pair’s July 18 retreat from the yearly high amid the overbought RSI conditions, the traders might witness another pullback from the 2025 peak as the key momentum indicator again turns overbought with the current reading of 77.00. Also acting as an upside filter is a rising trend line from June 16, close to $0.3500 by the press time.
In a case where the TRX/USD provides a daily closing beyond $0.3500, the bulls can ignore the overbought RSI and approach the 23.6% Fibonacci retracement of Tron’s September-December 2024 rally, close to $0.3800.
Following that, the $0.4000 threshold and all-time high marked during late 2024, close to $0.4500 will be in the spotlight.
Alternatively, TRX/USD pullback may initially aim for the 38.2% Fibonacci ratio of $0.3350 before confronting a broad support area holding its importance since December 2024, around $0.2950-$0.3100.
In a case where the TRX bears manage to conquer the $0.2950 support, the 100-day and 200-day SMAs, respectively near $0.2775 and $0.2575, could test the downside momentum before the final defense of the bulls, namely an ascending support line from November 2024, surrounding $0.2400 by the press time.
Tron: Four-Hour Chart Keeps Buyers Hopeful

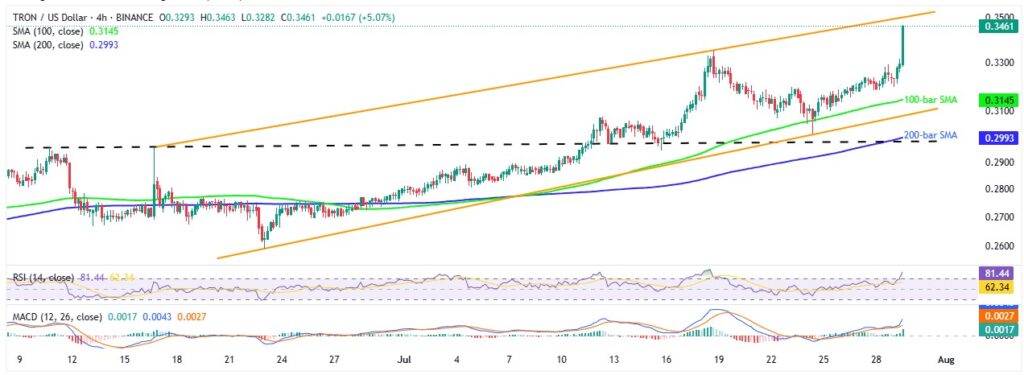
On the four-hour chart, TRX/USD portrays a six-week-old bullish trend channel to defend the upside bias, as long as the quote trades between $0.3500 and $0.3070. Also acting as short-term support is the 100-bar SMA support $0.3145.
Even if the quote drops beneath the $0.3070 support and defies the bullish chart formation, the 200-bar SMA of $0.2990 and the previous resistance line from June 10, near $0.2980 at the latest, will challenge the Tron bears from taking control.
That said, the RSI condition remains overbought on the four-hour chart while the MACD indicator flashes bullish signals, suggesting a gradual run-up within the channel formation.
Should the TRX/USD pair defy the bullish pattern, the daily chart levels will be in the spotlight.
Overall, Tron looks poised to challenge its record high, although the $0.3500 hurdle may temporarily test the strength of buyers.


