- Uniswap and Litecoin surge with rising crypto optimism, drawing strong technical interest through standout charts.
- UNI jumps 20%, breaks two-month resistance, while reaching its highest level since February.
- LTC climbs to a 4.5-month high, testing key resistance trendline from December 2024.
- Overbought RSI poses resistance, but key SMA breakouts and bullish MACD signals keep buyers optimistic.
On Friday, Uniswap (UNI/USD) and Litecoin (LTC/USD) showcased strong crypto market optimism by reaching multi-month highs.
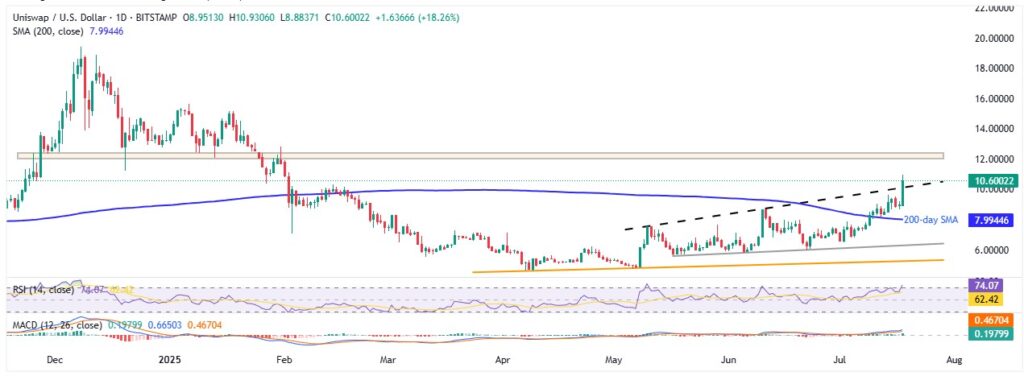
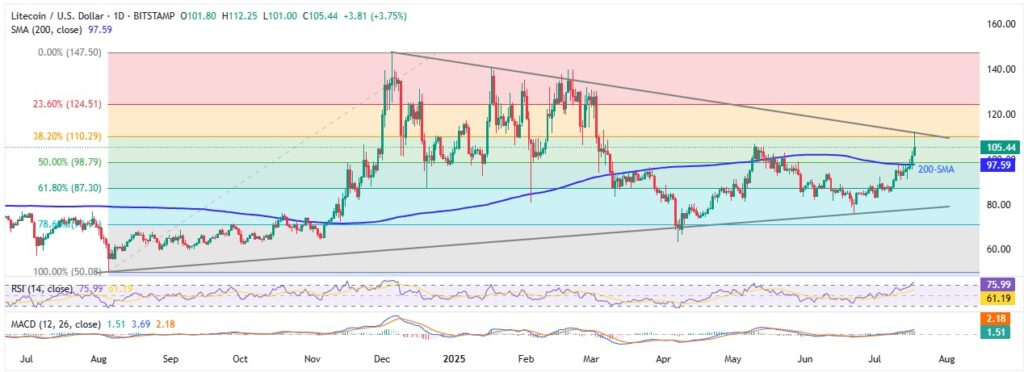
UNI surged 20% intraday to nearly $10.75, its highest since February, while LTC hit a 4.5-month resistance level before pulling back to $105.45, still up 3.75% on the day—highlighting growing bullish momentum amid broader crypto enthusiasm.
It’s worth noting that UNI/USD and LTC/USD both defend previous breakouts above the 200-day Simple Moving Average (SMA), while the Moving Average Convergence Divergence (MACD) indicators show bullish signals. However, the overbought 14-day Relative Strength Index (RSI) warns buyers of a crucial challenge ahead.
UNI/USD: Daily chart signals critical test for bulls ahead

Uniswap stays firmer past an ascending trendline from early May, turning the $10.00 level into strong immediate support. In doing so, the UNI/USD pair also extends its July breakout past the crucial 200-day SMA. The quote also remains sturdy above the mid-February high of $10.30, backed by bullish MACD signals at a fresh 5.5-month peak.
However, the 14-day RSI is deep in overbought territory near 74.40, signaling strong buying pressure but warning of potential profit-taking ahead. The same highlights the next resistance zone, sitting between $12.00 and $12.40, which have challenged traders since November 2024.
If UNI buyers push beyond $12.40, the road opens to major targets: the mid-January high of $15.20, the yearly peak at $15.65, and ultimately the late-2024 top near $19.45.
On the flip side, immediate support lies at $10.30 and $10.00, with a softer floor around June’s peak at $8.65.
That said, stronger support rests near the 200-day SMA at $7.99, with trendline supports from May and April, around $6.32 and $5.25 respectively, challenging the UNI bears afterward.
LTC/USD: Daily chart highlights buyer’s retreat

Litecoin pulls back after testing a descending resistance line in place since December 2024, close to $112.00 by the press time, with the overbought 14-day RSI hovering near 76.77. This setup hints at more pullback in the LTC/USD prices unless buyers hold key support levels.
A daily close below May’s peak at $107.00 would confirm bearish pressure, opening the door to $100.00 and the 200-day SMA at $97.60. If the 200-day SMA gives way, focus shifts to the March and June highs near $96.55 and $94.15. Below that, the 61.8% Fibonacci retracement of the August–December 2024 rally at $87.30, followed by the rising trendline from August near $77.00, will be crucial defenses for LTC bulls.
Alternatively, a break above the key resistance at $112.00 could recharge bullish momentum. If confirmed, targets line up at February’s peak of $139.75, then the January high at $141.00, and finally the 2024 top at $147.25—with $150.00 rounding out the upside path.
Conclusion
Despite overbought RSI signals, both Uniswap and Litecoin hold firm above their 200-day SMA breakouts. However, UNI’s decisive move above multi-month resistance and persistent MACD strength suggest greater upside potential, while LTC still needs a confirmed break above the $112.00 barrier to validate further gains.


