- Uniswap price edges higher as bulls defend rebound from multi-month support.
- Sustained trading beyond key SMAs, upbeat RSI strengthens recovery hopes.
- Fortnight-long falling trend line guards immediate upside before the key $12.10-$12.40 resistance zone.
- UNI may grind higher toward July top, but erasing yearly decline is uncertain.
Uniswap (UNI) price reverses the previous weekly loss by rising for the second consecutive day to $10.10 during Thursday’s European session. In doing so, the altcoin defends Sunday’s U-turn from a six-month horizontal support, backed by the upbeat 14-day Relative Strength Index (RSI).
The UNI market cap also recovers, climbing to $6.18 billion after bouncing from a multi-day low on August 2. The trading volume, however, remains subdued at around $285.48 million at the latest.
Still, the Moving Average Convergence Divergence (MACD) indicator flashes bearish signals and joins multiple upside hurdles to challenge the UNI bulls in targeting a total reversal of the yearly loss of 25%.
Uniswap Price: Daily Chart Favors Short-Term Bullish Bias

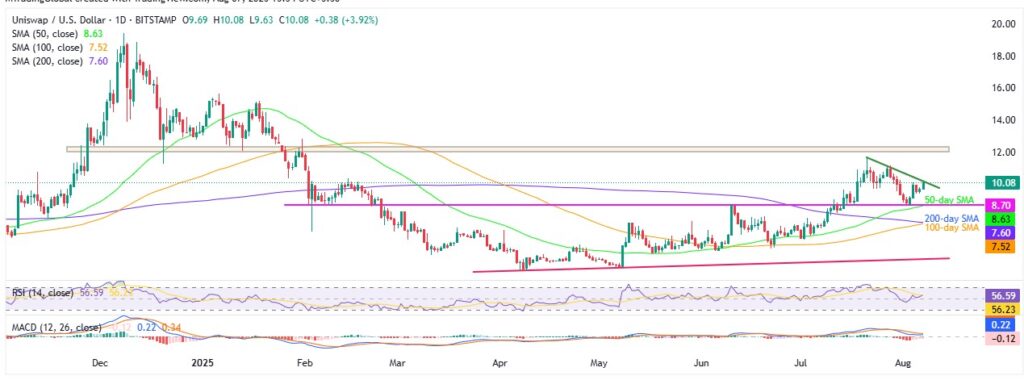
Uniswap’s rebound from a six-month-old horizontal support joins the above-50.0 RSI line to favor buyers as they approach a two-week descending trend line resistance surrounding $10.30. The quote’s sustained trading beyond the key Simple Moving Average (SMA) also backs the upside bias surrounding UNI.
With this, the bulls are likely to overcome the $10.30 hurdle and aim for the previous monthly high of $11.66.
However, a broad resistance area from November 2024, between $12.10 and $12.40, will be a tough nut to crack for the Uniswap buyers.
If the UNI price remains firmer past $12.40, the odds of witnessing a rally targeting January’s peaks surrounding $15.20 and $15.65 can’t be ruled out. Following that, the late 2024 high around $19.44 and the $20.00 psychological magnet will be in the spotlight.
Alternatively, UNI pullback remains elusive beyond the six-month support line, near $8.70. Further, the 50-day SMA of around $8.63 acts as the short-term downside filter.
Should the Uniswap price drop below $8.63, a convergence of the 100-day and 200-day SMAs around $7.60-$7.51 will be a tough nut to crack for the bears before retaking control and targeting the yearly low marked in April around $4.56.
Uniswap Price: Four-Hou
Uniswap Price: Four-Hour Chart Highlights Immediate Trading Range

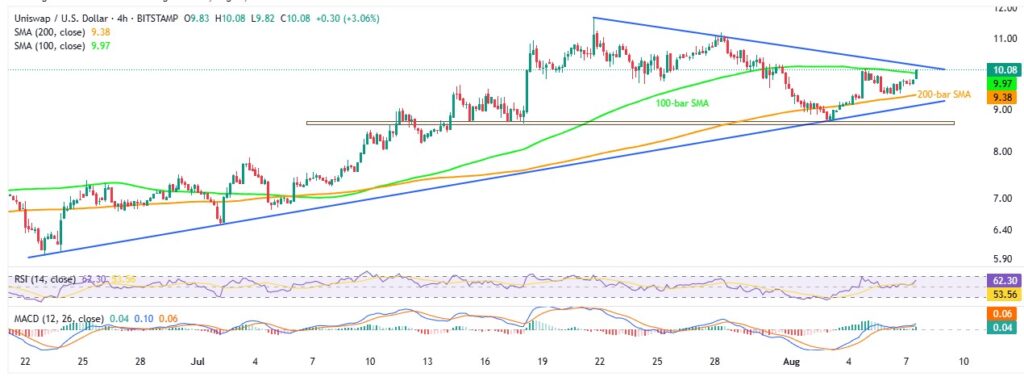
UNI remains between a fortnight-old resistance line and a six-week-long trend line support, currently around $10.30 and $9.10, on the four-hour chart. Additionally, the 200-bar and 100-bar SMAs, close to $9.38 and $9.97 in that order, also restrict the quote’s nearby moves.
It’s worth noting, however, that the RSI and MACD conditions are comparatively more bullish on the four-hour chart than the daily projection, which in turn suggests an upside break of the immediate $9.97 and $10.30 resistances. This will allow the UNI bulls to concentrate on the higher levels discussed on the daily chart.
Meanwhile, a downside break of an ascending trend line from late June, close to $9.10, will have a four-week horizontal support zone surrounding $8.60-$8.50 to watch before concentrating on the daily chart levels.
Conclusion
Uniswap looks poised to clear the immediate upside hurdle and challenge July’s peak, backed by a reversal from the key support and upbeat momentum indicators.
However, the quote’s reversal of the yearly losses will need a strong fundamental catalyst that can allow it to cross $12.40 hurdle and stay beyond that.
Also: Market Digest: Bitcoin Holds Near 115K as the World Splits on Trade and Diplomacy


