- Uniswap finds firmer footing after two-day losing run, still down 46% in 2025.
- RSI suggests growing buyer interest, but UNI still has to clear layered technical hurdles.
- UNI needs to keep $6.20 to avoid deeper losses; only a break above $12.50 revives full recovery potential.
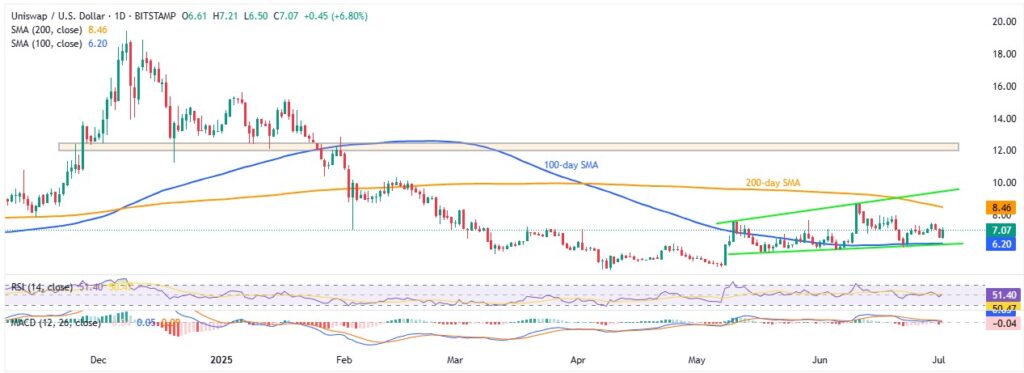
Uniswap (UNI/USD) snaps a two-day losing streak while rising 7.0% intraday to $7.08 heading into Wednesday’s U.S. session. In doing so, the UNI prices recover above the $6.20 support confluence comprising the 100-day Simple Moving Average (SMA) and six-week ascending trend line. Even so, the UNI/USD pair remains 46.0% down since the start of 2025.
UNI/USD: Daily chart suggests further recovery

Source: TradingView
Uniswap’s bounce from the $6.20 support zone is gaining strength, backed by a firmer 14-day RSI above 50.00—but a weak MACD keeps bulls cautious.
If momentum holds, UNI/USD could aim for the late-June high near $8.00, then challenge the 200-day SMA at $8.46 and a rising resistance line near $9.50. A breakout above $9.50 could open the door toward the $12.00–$12.50 zone—crucial for reversing the token’s 2025 losses.
On the flip side, a break below $6.20 would likely drag UNI toward May’s low of $4.75 and the yearly bottom at $4.56. Deeper declines could expose $3.83 and $3.63, with the record low of $0.0120 (August 2022) far in the rear-view but still on the map.
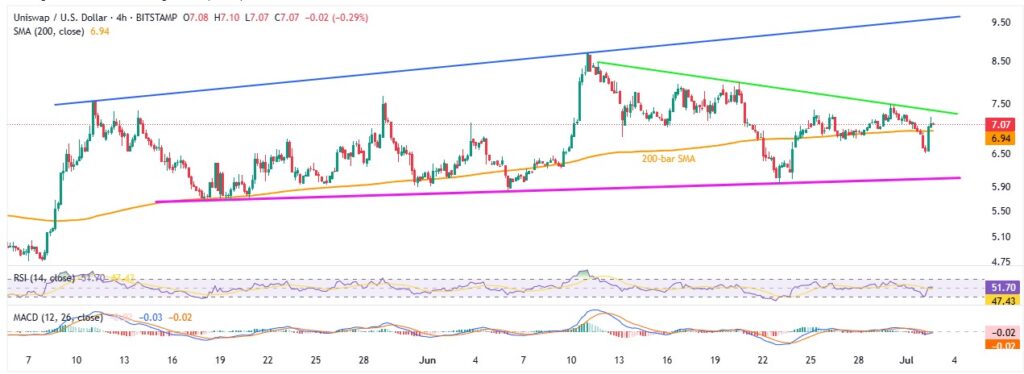
UNI/USD: Four-Hour chart suggests gradual recovery

Source: TradingView
On the four-hour chart, the UNI/USD pair shows signs of recovery but struggles below key resistance, despite a firm RSI and conflicting MACD signals.
The rebound from recent lows faces a tough test at $7.40—a level that has capped gains for the past three weeks. A break above this could open the door to $9.50, marked by an ascending trendline from early May, before highlighting the daily chart levels.
Alternatively, support near $6.00, backed by a rising trendline from mid-May, could cushion any pullback moves, other than the $6.20 key support.
To sum up, UNI may continue to recover in the short term, but reclaiming the 46% yearly loss remains a big challenge unless bulls break past $9.50 with conviction.


