- Uniswap price gains over 2.0% to reverse pullback from a 7.5-month high.
- UNI edges higher past 21-day SMA after rejection at multi-month resistance, as RSI and MACD challenge downside bias.
- Uniswap bears eye short-term rising wedge as clear break below $9.50 could confirm their control.
- UNI struggles to extend four-month uptrend, hinting at near-term consolidation, though a bearish reversal looks unlikely.
Uniswap (UNI) price rises over 2.0% to $11.34 on Tuesday’s U.S. trading session, following its reversal from the highest level since January 31. The momentum oscillators, 14-day Relative Strength Index (RSI), and the Moving Average Convergence Divergence (MACD) conditions favor the one-week-old recovery momentum.
However, the UNI price portrays failure to cross a multi-month-old horizontal resistance zone. Additionally, it would be interesting to see whether last week’s 21-day Simple Moving Average (SMA) breakout will occur to augment the further momentum.
Meanwhile, Uniswap’s trading volume rises for the third consecutive day to a three-week high of $1.11 billion, according to the Santiment data, suggesting increased participation even if the prices are down. The market cap retreats from its January-end peak to $6.85 billion in the last 24 hours
Uniswap Price: Daily Chart Signals Consolidation

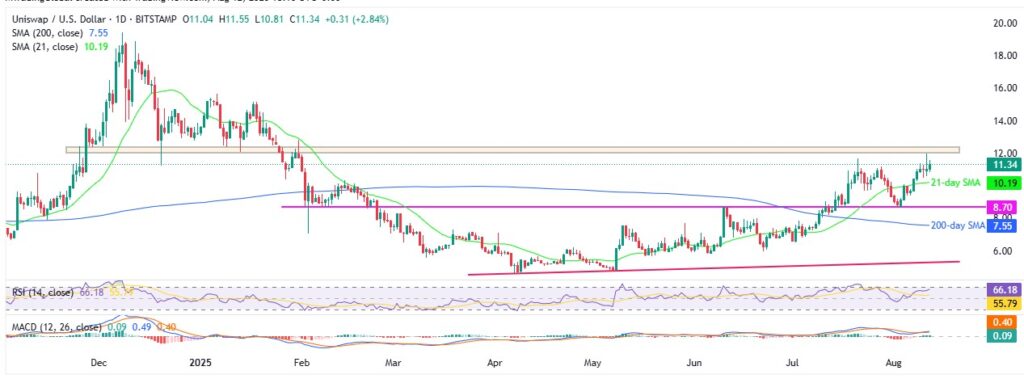
On the daily chart, the Uniswap price fails to break a key horizontal resistance around $12.0 held since November 2024, and the RSI dribbles, hinting at a downside toward the 21-day SMA support near $10.17, potentially undoing last week’s breakout.
However, the RSI line is still between 50.00 and 70.00, suggesting strong upside momentum, and joins hands with the bullish MACD signals to highlight a 6.5-month-old horizontal support region surrounding $8.70. The $10.00 and $9.00 round figures might act as additional downside filters.
In a case where the UNI bears break the $8.70 support level, the 200-day SMA of $7.55 will be the bull’s last defense.
Alternatively, an upside clearance of the $12.00-$12.40 resistance zone could direct the UNI buyers toward the tops marked in January, close to $15.15 and $15.65.
Following that, $17.50, $18.90, and the December 2024 top of $19.44, quickly followed by the $20.00 psychological magnet, will be the key watch for Uniswap buyers.
Uniswap Price: Four-Hour Chart Highlights ‘Rising Wedge’

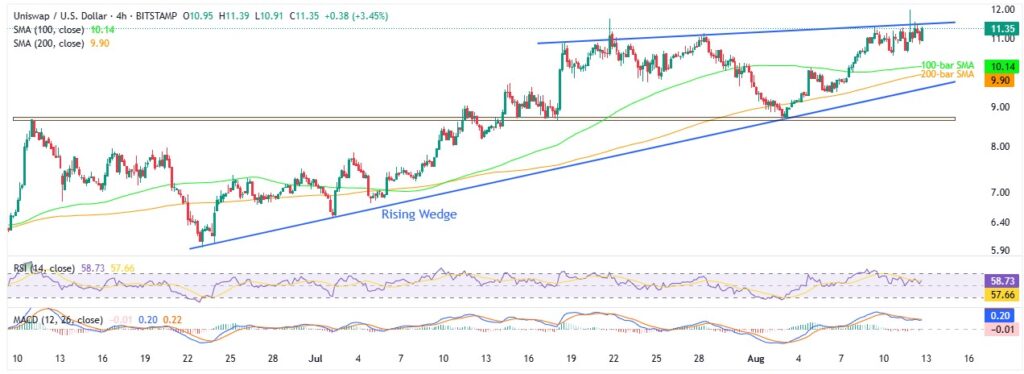
Uniswap’s previous retreat portrays a ‘rising wedge’ bearish formation on the four-hour chart, currently between $9.50 and $11.55. The same joins the near-50.00 RSI and sluggish MACD signals to suggest short-term consolidation in the UNI price.
Hence, the 100-bar and 200-bar SMAs, respectively near $10.10 and $9.90, seem luring Uniswap sellers before directing them to the key $9.50 support level.
It’s worth noting that a two-month-old horizontal area surrounding $8.75-$8.65 and June’s low of $5.95 could act as additional downside filters for the UNI past $9.50 and before the rising wedge’s theoretical target of $3.50.
Conclusion
With a failure to clear the key resistance, Uniswap suggests a short-term pullback within a strong four-month bullish trend. However, solid momentum and supportive indicators defend the broader uptrend, keeping the UNI recovery hopes alive.
Also read: Market Digest: BTC Slips to $119K as Traders Eye CPI, Tariff Truce and Alaska Talks


