- Uniswap price drops for the second straight day, extending pullback from weekly top.
- Bearish candlestick and 200-day SMA turn UNI sellers’ focus to monthly losses.
- Weakening bearish momentum and several strong support levels signal a slowdown in selling.
- UNI may consolidate in the short-term, but a gradual slide toward a yearly low remains likely.
Uniswap (UNI) drops over 2.0% intraday to $7.57 early Tuesday, extending the previous pullback from the weekly top.
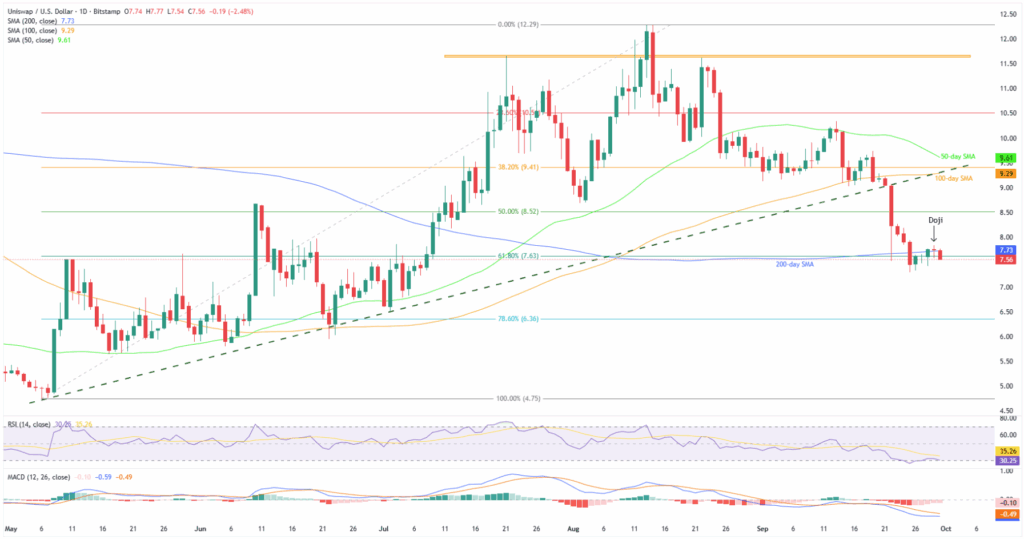
The altcoin’s latest fall justifies Monday’s Doji candlestick and a reversal from the 200-day Simple Moving Average (SMA) resistance.
Adding strength to the downside bias is upbeat trader participation when the UNI price drops, per the trading volume, as well as a pullback in the market capitalization (market cap). According to Santiment, Uniswap’s daily trading volume jumps to a four-day high of $236.67 million, whereas the market cap retreats from a week’s high to $4.76 billion at the latest.
Still, nearly oversold conditions of the 14-day Relative Strength Index (RSI) and weakening bearish pressure per the Moving Average Convergence Divergence (MACD) momentum indicator challenge the UNI bears as they approach a short-term key support.
With this, it’s safe to say that Uniswap bears remain in control, keeping the downside bias intact. However, the market may see a brief consolidation phase as sellers catch their breath before attempting the next leg lower.
Also read: Vanguard Mulls Crypto ETF Trading As SEC Deadlines Loom
Uniswap Price: Daily Chart Points To Limited Downside Room

Monday’s Doji candlestick and a clear U-turn from the 200-day SMA favour Uniswap sellers as they approach the monthly low surrounding $7.30, the lowest level since early July.
The quote’s further downside, however, appears to be difficult as the RSI line hits the oversold limit of 30.00.
Even if the UNI bears ignore the overheated RSI conditions and flash a fresh monthly low past $7.30, the 78.6% Fibonacci retracement of its May-August upside, near $6.36, will precede a slew of support levels near $5.80 and $5.65 to limit the south-run.
Below that, May’s bottom of $4.75 and the yearly low marked in April around $4.55 will be in the spotlight.
Alternatively, the 200-day SMA and Monday’s top, respectively near $7.73 and $7.83, guard short-term Uniswap recovery.
After that, a 50% Fibonacci ratio of $8.52 and June’s peak of $8.68 could lure the UNI bulls before challenging them with a $9.29-$9.30 resistance confluence, comprising the 100-day SMA and previous support line from May.
Also acting as a strong upside hurdle is the 50-day SMA level of $9.61, and the $10.00 psychological magnet, both of which appear to be the final defense of UNI bears.
Uniswap Price: Four-hour Chart Favors Bears

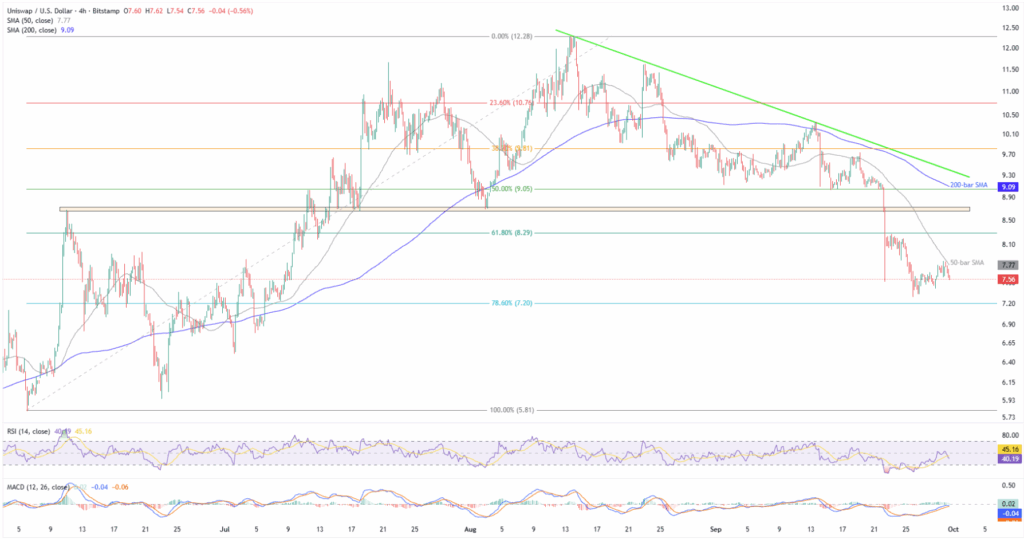
On the four-hour chart, UNI reverses from the 50-bar SMA and faces an absence of the oversold RSI to suggest further downside. Also favoring the short-term sellers is the impending bear cross on the MACD indicator.
With this, the latest low of $7.29 and the 78.6% Fibonacci ratio of June-August upside, near $7.20, could test the short-term Uniswap sellers before the deeper levels discussed on the daily chart.
Alternatively, an upside clearance of the 50-bar SMA hurdle of $7.77 will have a tough nut to crack around $8.65-$8.73, comprising levels marked since early June.
Furthermore, the 200-bar SMA and a six-week resistance line, close to $9.09 and $9.41 in that order, appear to be the final defense of the UNI bears before directing buyers to the daily chart’s higher levels.
Conclusion
A bearish candlestick formation and U-turn from the 200-day SMA keep Uniswap bears hopeful even as oversold RSI suggests short-term consolidation.
Also read: Crypto Weekly Price Prediction: BTC, ETH & XRP all Tumble as U.S. Data Fuels Dollar, NFP Eyed


