- Uniswap surges 10% to its highest level since late February, extending last week’s breakout of key resistance confluence.
- Clear break above 200-day SMA and five-month resistance, with bullish MACD and RSI, favors UNI bulls.
- Mid-February high and Nov 2024 resistance zone to test UNI/USD bulls as RSI nears overbought region.
- UNI sellers remain absent above $7.40; upside break of $12.40 could target yearly top.
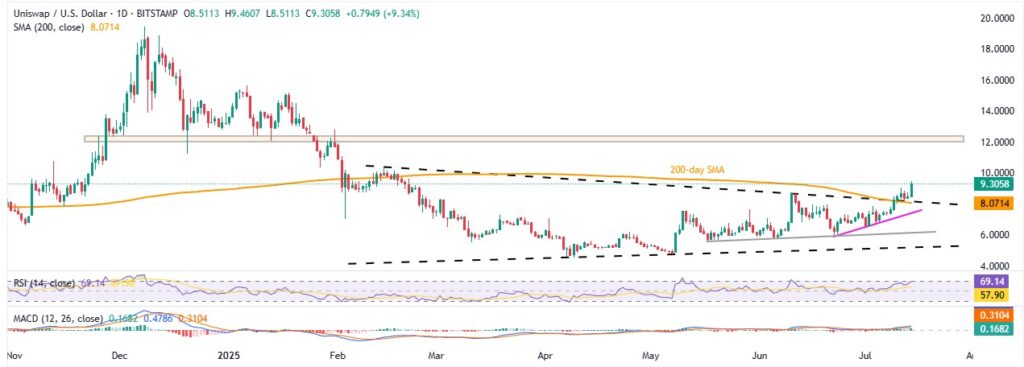
Uniswap (UNI/USD) surged nearly 10% intraday to $9.32 during Monday’s European session, marking its highest level since late February. In doing so, the UNI/USD pair firmly holds above last week’s breakout of a crucial resistance zone, now acting as support, which includes the 200-day Simple Moving Average (SMA) and a downward-sloping trendline from mid-February—both forming part of a five-month symmetrical triangle pattern.
Additionally, the 14-day Relative Strength Index (RSI) remains comfortably above the 50.00 neutral level but has yet to reach the overbought threshold of 70.00, while bullish momentum is reinforced by positive signals from the Moving Average Convergence Divergence (MACD) indicator. Together, these technical indicators keep UNI bulls optimistic for further upside potential.
UNI/USD: Daily chart lures bulls

Last week, UNI/USD broke above key $8.10 resistance—now support—formed by the 200-day SMA and a five-month trendline in a symmetrical triangle. After a brief pullback, prices bounced back to a multi-month high amid bullish RSI and MACD, eyeing the late February swing high near $10.34.
With RSI nearing overbought, $10.34 is a crucial resistance; breaking it targets the November 2024 zone between $12.10 and $12.40—the last defense for bears. A break above $12.40 could push UNI toward yearly highs near $15.65, then to the previous yearly high of $19.45, and the $20 psychological mark.
Alternatively, a daily close below $8.10 risks a UNI pullback to the three-week ascending support near $7.40. Below that, supports at $6.60, $6.20, and the triangle’s bottom at $5.20 come into play.
UNI/USD: Four-Hour chart highlights immediate upside hurdles

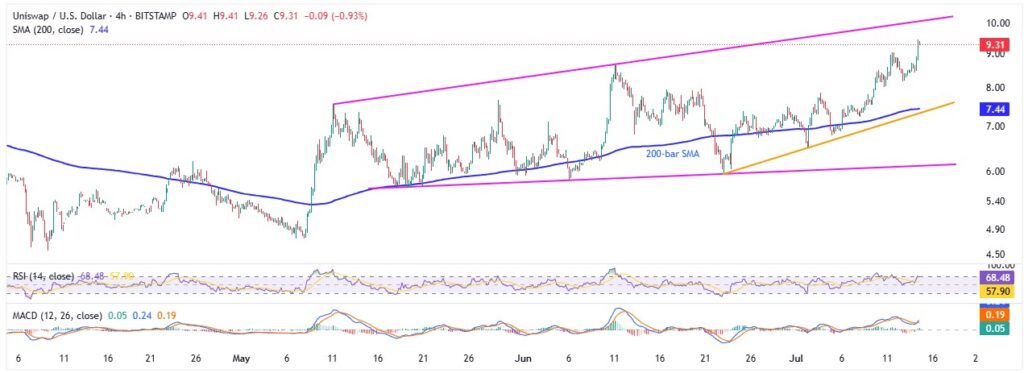
Unlike the daily chart, the four-hour chart shows immediate upside hurdles for UNI/USD, with the RSI nearing overbought levels. This highlights a two-month-old rising trendline resistance within a bullish megaphone pattern, currently between $10.10 and $6.10.
That said, key short-term supports include the 200-bar SMA near $7.44 and a three-week rising support line around $7.30.
Overall, UNI/USD is expected to stay firm despite an imminent short-term pullback.


