- Uniswap stays on the front foot within multi-month symmetrical triangle.
- UNI bulls approach key confluence of triangle resistance and 200-day SMA.
- Upbeat RSI and MACD, along with steady trading above key SMAs, keep UNI/USD bulls hopeful of breaking the $8.20 barrier.
- Buyers need decisive break of $12.40 to fully erase yearly losses, sellers face a long road to regain control.
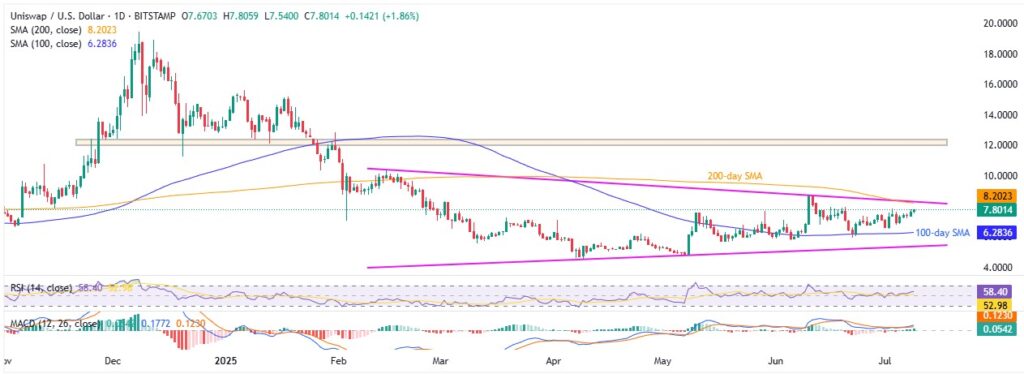
Uniswap (UNI/USD) rises nearly 10.0% to $8.30 during Wednesday’s U.S. session, holding onto gains from the previous day. The price now approaches a key resistance zone marked by the upper boundary of a multi-month triangle and the 200-day Simple Moving Average (SMA), a breakout above which could help reverse UNI’s 40% loss in 2025.
Supporting the bullish outlook are sustained gains above the 100-day SMA, a positive 14-day Relative Strength Index (RSI), and strengthening signals from the Moving Average Convergence Divergence (MACD).
UNI/USD: Daily chart signals upside potential

Source: TradingView
Uniswap’s sustained trading above the 100-day SMA, backed by bullish MACD signals and an RSI holding above 50 without entering overbought territory, strengthens bullish momentum as the token approaches the key $8.30 resistance. This level is reinforced by the 200-day SMA and the upper boundary of a symmetrical triangle that has capped gains since mid-February.
A decisive move above $8.30 could open the door for UNI to target June’s high at $8.67, followed by the mid-February swing peak at $10.33. Beyond that, a major horizontal resistance zone between $20.00 and $20.40 — established since November 2024 — stands as the final barrier for UNI/USD bears before bulls gain full control.
On the flip side, immediate downside appears limited by the $7.00 psychological level, followed by the 100-day SMA support near $6.28 and the triangle’s lower boundary around $5.35. A break below $5.35 could deepen UNI bearish pressure, exposing April’s low at $4.55 and even June 2023’s bottom near $3.63.
UNI/USD: Four-Hour chart portrays bull’s immediate battle

Source: TradingView
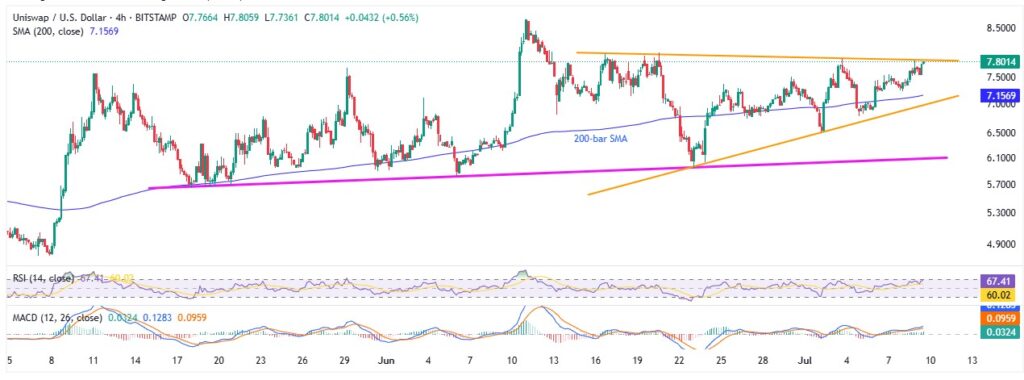
While the daily chart shows room for further upside, the four-hour chart reveals that UNI/USD bulls tested and breached a three-week resistance trendline near $7.81.
The Relative Strength Index (RSI) nearing overbought territory, a break above $7.81 could deliver strong immediate gains. This makes June’s peak at $8.67 a critical level to watch for sustained bullish momentum, in addition to the resistance zones outlined on the daily chart.
Alternatively, initial support comes from the 200-bar Simple Moving Average (SMA) at $7.15, followed by a two-week-old rising trendline that forms part of the triangle pattern near the $7.00 level. Further below, a key horizontal support zone around $5.80–$5.65 — in place for the past seven weeks — acts as a final short-term buffer before daily chart support levels come into play.
Overall, Uniswap (UNI/USD) remains in bullish focus and could gradually climb past the $8.30 barrier.


