- Uniswap price snaps two-day losing streak, surges over 9.0% to cross 200-day EMA.
- UNI extends rebound from 100-day EMA; bullish momentum and 200-day EMA breakout point to further gains toward bullish channel top.
- Clear break above $12.43 needed to revisit late 2024 peak.
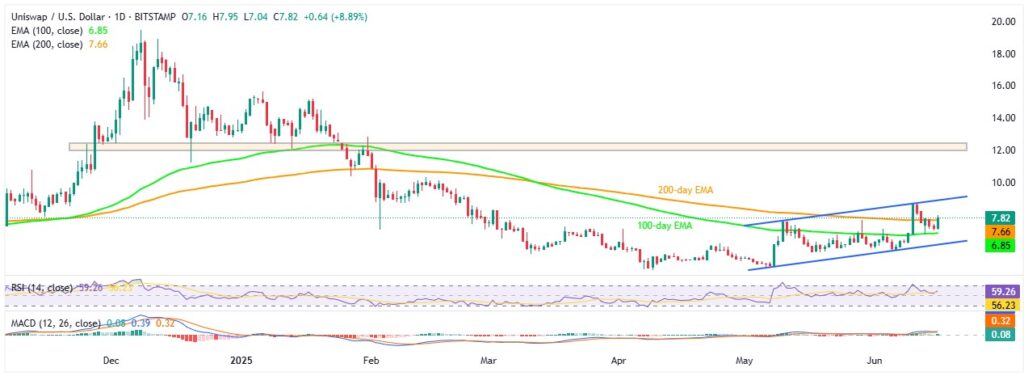
Uniswap (UNI/USD) braces for its biggest daily gain in a week, marking its first positive session in three days as it breaks above the 200-day Exponential Moving Average (EMA) during Monday’s U.S. session. At the time of writing, UNI is up over 9.0% intraday, trading around $7.87.
The move builds on sustained strength above the 100-day EMA and is supported by bullish momentum signals from the 14-day Relative Strength Index (RSI) and the Moving Average Convergence and Divergence (MACD) indicator. With the recent breakout above the 200-day EMA, the UNI/USD pair appears positioned for further upside. However, the top boundary of a five-week-old bullish channel — currently spanning from $6.20 to $8.91 — poses a key challenge for bulls as they attempt to extend control.
UNI/USD: Daily Chart Favors Bulls

Source: Tradingview
Uniswap’s successful rebound from the 100-day EMA last week, combined with an RSI holding above 50.00 and bullish MACD signals, helped UNI buyers overcome the 200-day EMA hurdle. However, further upside requires confirmation with a clear break above the top line of the five-week-old bullish channel, near $8.91, before targeting the key resistance zone between $12.10 and $12.50, marked since November 2024.
On the downside, a break below the 100-day EMA around $6.85 does not guarantee a bearish reversal, as the channel’s bottom line near $6.20 remains a strong support level. Bears would need to push below this to test the yearly low near $4.56.
It should be noted that the 200-day EMA level of $7.66 acts as an immediate support for the UNI prices.
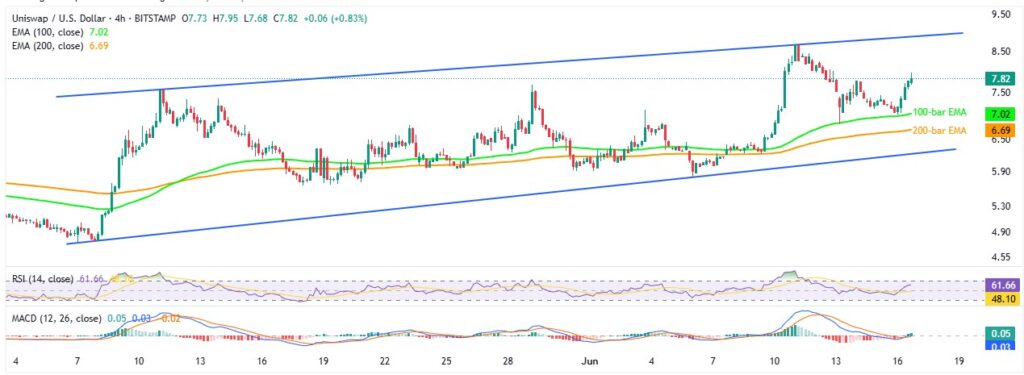
UNI/USD: Four-Hour Chart Signals Limited Upside Room

Source: Tradingview
Unlike the daily chart, the four-hour chart already shows UNI/USD trading successfully above both the 100-bar and 200-bar EMAs. Supported by bullish MACD signals and an RSI hovering between 50 and 70, this suggests further advances toward the bullish channel’s top near $8.91.
However, with the RSI quickly approaching overbought levels, breaking above the $8.91 resistance may prove challenging for UNI bulls. A decisive break there would then shift focus to the resistance levels highlighted on the daily chart.
Alternatively, the 100-bar and 200-bar EMAs at approximately $7.02 and $6.69, respectively, act as initial support before the channel’s bottom near $6.20 limits short-term pullbacks. Below that, the monthly low of $5.80 provides additional downside support ahead of the key daily chart levels.
Overall, Uniswap prices are likely to hold firm, but upside potential appears limited for now.


