- Uniswap price fades bounce from a six-week low, challenging a four-month uptrend.
- UNI drops back towards the 100-day SMA as bearish momentum builds and markets await FOMC.
- Rejection from the 50-day SMA adds to the bearish bias targeting the multi-month support line.
- Short-term bearish channel keeps Uniswap sellers hopeful; 200-day SMA is the key support to watch for a trend reversal.
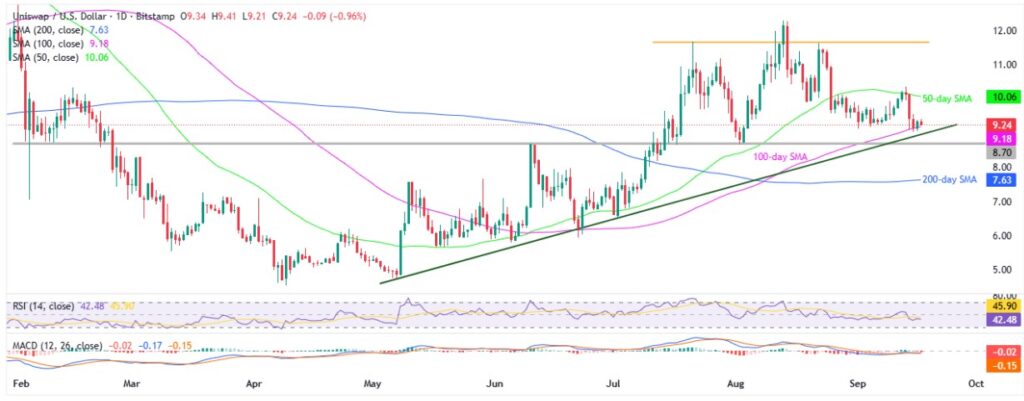
Uniswap (UNI) price drops 0.70% intraday to $9.26 early Wednesday morning in New York, fading prior recovery from the 100-day Simple Moving Average (SMA) as markets position for the U.S. Federal Reserve (Fed) Interest Rate Decision.
Bearish signals from the Moving Average Convergence Divergence (MACD) and downbeat conditions of the 14-day Relative Strength Index (RSI) momentum indicators also lure the UNI sellers.
Still, Uniswap’s trading volume drops for the third consecutive day, and the market capitalization (market cap) also remains pressured, suggesting lower trader participation as the price softens, highlighting support levels for potential rebound. According to Santiment, UNI’s daily trading volume drops to $260.11 million, down for the third consecutive day, while the market cap also retreats to $5.84 billion, reversing the previous recovery from a six-week low.
For more crypto-centric updates, check out our Coin Bytes!
With this, the UNI sellers flex their muscles ahead of the key Federal Open Market Committee (FOMC) monetary policy announcements while posting the first monthly loss in five, so far, challenging the broad bullish trend. Read Details!
Uniswap Price: Daily Chart Keeps Sellers Hopeful

A clear U-turn from the 50-day SMA and failure to defend recovery from the 100-day SMA join the bearish MACD signals and a downbeat RSI, not oversold but below the 50.00 threshold, keep the short-term UNI sellers hopeful.
This highlights the 100-day SMA support of $9.18 and an ascending trend line from early May, close to $8.96, as decisive levels to watch for the bears.
Below that, a seven-month-old horizontal area, close to $8.71-$8.70, appears to be a tough nut to crack for the UNI bears. That said, the 200-day SMA level of $7.63 appears to be the last line of defense for the bulls, a break of which could reverse the four-month uptrend and add to the yearly losses, currently around 30%.
On the flip side, UNI’s recovery might aim for the $10.00 threshold before taking another bite at the 50-day SMA hurdle of $10.06 and the monthly high of $10.34.
Should UNI bulls keep the reins past $10.34, they can very well target the $11.00 round figure before facing the key two-month horizontal resistance region surrounding $11.60–11.65.
After that, the previous monthly high of $12.28 and key January tops near $12.85, $15.15, and the yearly peak of $15.63 will be in the spotlight.
Uniswap Price: Four-Hour Chart Teases Short-Term Sellers

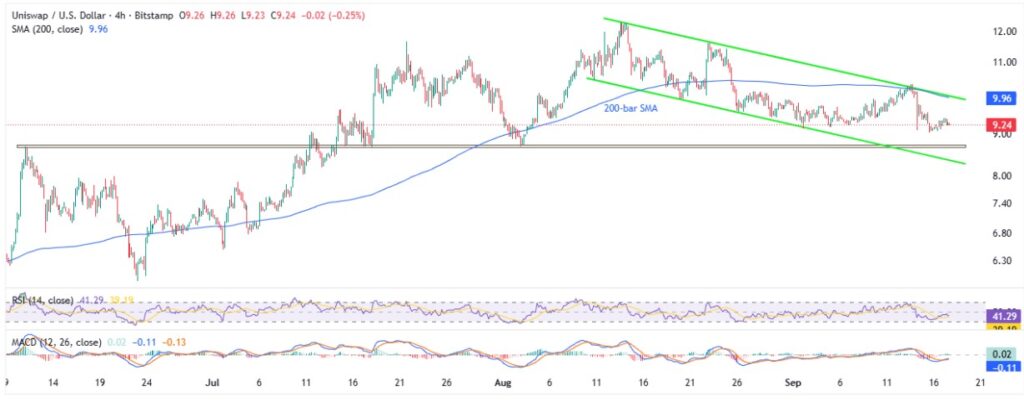
On the four-hour chart, a five-week descending trend channel joins the quote’s sustained trading beneath the 200-bar SMA to lure the sellers. The downbeat RSI conditions and sluggish MACD also reinforce a short-term bearish bias surrounding the altcoin.
This shifts the market’s attention to a three-month horizontal support near $8.75-$8.65 and the stated bearish channel’s bottom surrounding $8.34 before the daily chart’s deeper levels.
Meanwhile, a convergence of the 200-bar SMA and the channel’s upper boundary, close to $9.96, appears to be a short-term key resistance level to watch for the bulls, a break of which will highlight the higher levels discussed on the daily chart.
Conclusion
Uniswap is facing bearish pressure in the short term, with downbeat momentum, and several resistance points weighing on its price.
However, the UNI’s overall upward trend from May is still holding strong, as long as the price stays above the important $8.75-$8.65 support confluence, giving confidence to long-term investors.
Also read: Cryptocurrency Weekly Price Prediction: BTC, ETH, XRP Rally as Markets Bet Big on FOMC Rate Cuts


