- Uniswap price drops 3.0%, posting the first daily loss in three within a bearish channel.
- Late September breakdown, sustained trading below key EMAs favors UNI sellers.
- Absence of oversold Stochastic lower guards for UNI bears.
- Uniswap could face its first yearly loss in three years as long as it stays below $9.53.
Uniswap (UNI) price drops around 3.0% intraday to $8.00, before bouncing off to $8.11 early Tuesday morning in New York, during its first daily loss in three.
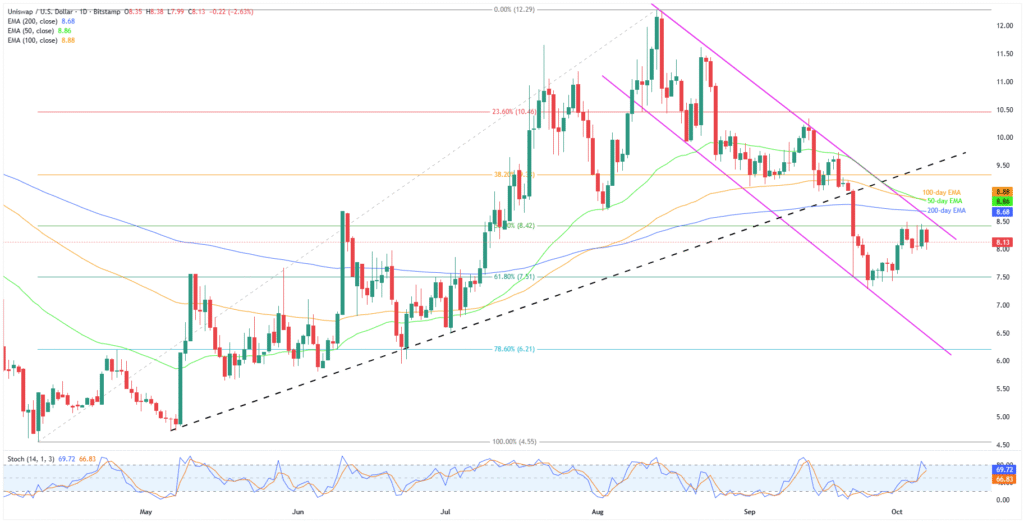
The altcoin’s latest weakness could be linked to its sustained trading within a two-month descending trend channel and a clear downside break of the key Exponential Moving Averages (EMA).
Additionally, the late September breakdown of the key support line, now resistance, and an absence of oversold signals from the Stochastic momentum indicator, also defend the downside bias within a multi-week bearish chart setup.
Meanwhile, a five-day high trading volume of $301.29 million, and a pullback in the market capitalization (market cap) to $5.11 billion, according to Santiment, adds strength to the bearish bias.
Uniswap appears on track for its first yearly loss in three, despite potential intermediate bounces.
Also read: Top 5 Advanced Strategies to Spot Next Valuable Altcoin
Uniswap Price: Daily Chart Points To Further Downside

Uniswap’s late September breakdown of a five-month trendline support, now resistance, precedes the quote’s fall beneath the 200-day EMA to facilitate sellers.
Adding strength to the downside bias is the UNI’s sustained trading within a two-month descending trend channel bearish chart setup amid an absence of oversold Stochastic.
With this, the altcoin looks set to revisit the late September swing high near $7.83 before the 61.8% Fibonacci retracement of its April-August upside, near $7.51.
However, the aforementioned channel’s bottom and the 78.6% Fibonacci ratio, respectively near $6.44 and $6.21, could challenge the UNI bears targeting the yearly low of $4.55. During the process, the $6.00 and $5.00 could act as buffers.
Alternatively, Uniswap recovery needs validation from a 50% Fibonacci ratio of $8.42 and the stated channel’s top surrounding $8.65.
Even if the quote manages to cross the $8.65 hurdle, the 200-day and 50-day EMAs, near $8.68 and $8.86 in that order, could test the UNI bulls.
Beyond that, the 100-day EMA and previous support line from May, respectively around $8.88 and $9.53, will be the final line of defense for the Uniswap bears.
Uniswap Price: Four-hour Chart Signals Limited Downside Room

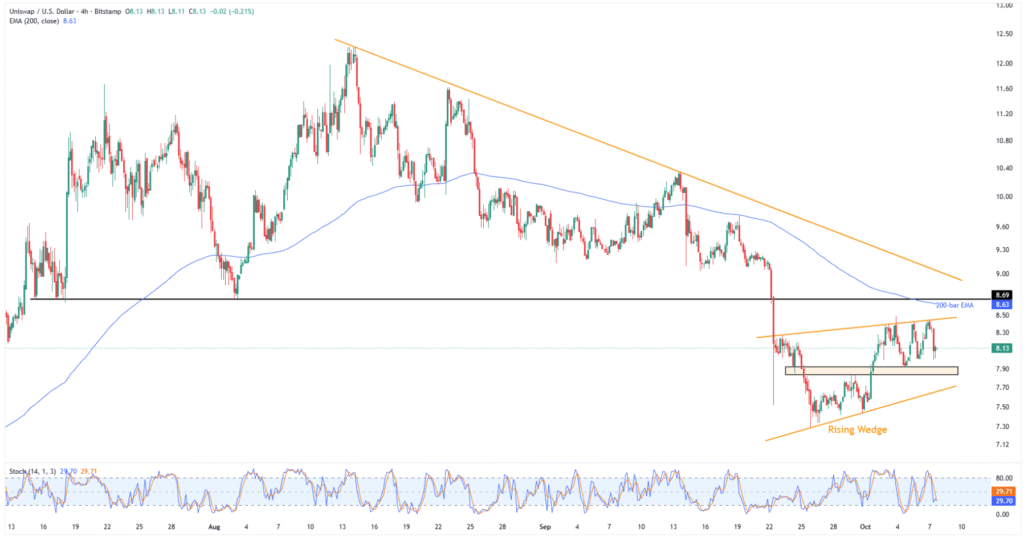
On the four-hour chart, Uniswap portrays a fortnight-old “Rising Wedge” bearish formation, currently between $8.46 and $7.66. That said, the quote’s clear break of a three-month horizontal support, now resistance near $8.69, as well as sustained trading beneath the 200-bar EMA of $8.64, keeps the bears optimistic.
Notably, the Stochastic conditions suggest a short-term consolidation in prices, highlighting the fortnightly support area near $7.93-$7.84.
It should be observed that the quote’s weakness past $7.66 could direct it to the rising wedge’s theoretical target of $6.50 and deeper levels discussed on the daily chart.
Meanwhile, an upside clearance of the $8.69 will have a descending resistance line from August, close to $9.05, as the last resort for bears before directing prices toward the daily chart’s higher levels.
Conclusion
Uniswap’s bearish chart formation, key support breakdowns, and an absence of oversold Stochastic together suggest a continuation of the downward move, pushing the quote towards its first yearly loss in three. However, the four-hour chart highlights intermediate halts along the way.


