- Bitcoin slips for the second day within two-week trading range, trimming weekly and monthly gains.
- Long liquidations, paused BTC ETF inflows, and cautious sentiment before the White House crypto report weigh on prices.
- Broad industry optimism, strong technical breakout, and whale activity keep BTC’s bullish momentum alive.
Bitcoin price (BTC/USD) remains defensive around $119,000 during Thursday’s session, staying downbeat for the second consecutive day within a two-week-old trading range.
In doing so, the BTC/USD pair trims its weekly and monthly gains after refreshing the all-time high (ATH) the last week during a four-month uptrend.
That said, the BTC traders take clues from the market’s consolidation ahead of the White House crypto report, backed by long liquidations and a pause in the U.S. spot Exchange-Traded Fund (ETF) inflows.
However, broad crypto industry optimism, support from ‘Crypto Week’ and U.S. President Donald Trump, plus strong whale activity and past technical breakouts keep BTC/USD buyers hopeful.
Long Liquidations Gain Attention
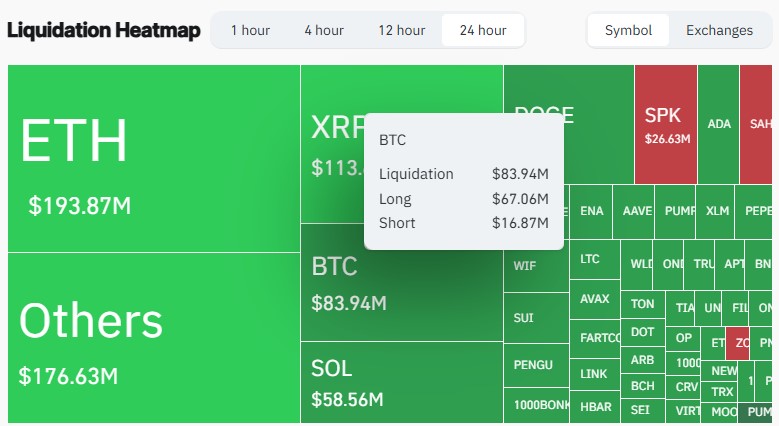
Among the key catalysts, profit-booking after a four-month rally and a record high gains major attention. CoinGlass data from its Liquidation Heatmap shows that long liquidations make up the lion’s share of total liquidations, indicating traders who previously bought BTC are now cashing out after a stellar rally.

Network Realized Profits Drop
According to CoinGlass, out of $83.94 million total liquidations, Long Liquidations (reversals of buy positions) accounted for $67.06 million, while Short Liquidations (covering sell positions) made up $16.87 million. The CoinGlass’s Liquidation Heatmap page also mentioned, “The largest single liquidation order happened on Binance – BTCUSDC value $2.96 million.”
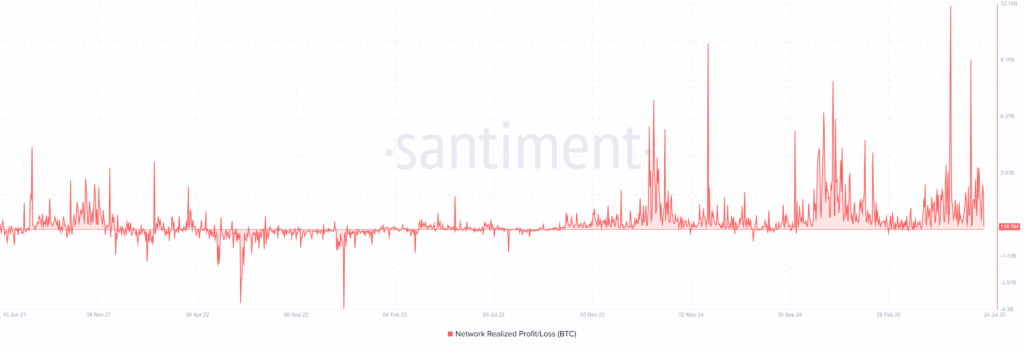
Apart from the long liquidations, the Santiment’s Network Realized Profit/Loss indicator also suggests the traders’ rush toward covering the positions even as even lesser profits. As per the Santiment’s glossary, Network Profit/Loss (NPL for short) computes the average profit or loss of all coins that change addresses daily.

As per the latest Santiment data, the Network Realized Profit for BTC traders have dropped to $138.5 million, the lowest since mid-April, for July 24.
BTC ETF Inflows Stall After Six-Week Ruling
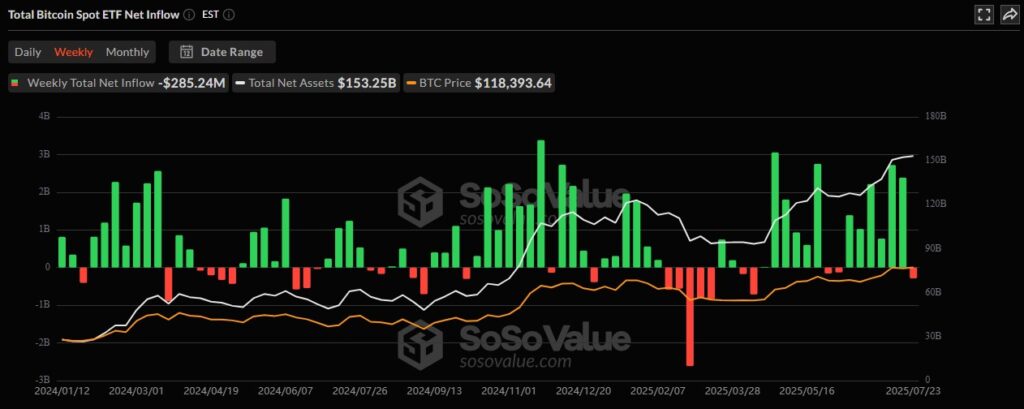
Apart from the position liquidations and a reduced network realized profit, a pause in the U.S. spot Exchange-Traded Fund (ETF) inflows also suggest the BTC trader’s consolidation mood. That said, the U.S. spot BTC ETF Net Inflows turned negative during the last three days, to -$85.96 million at the latest. This also portrays the first weekly negative, with the figures of $285.42 million, in the last seven weeks.

Whale Activity Doesn’t Disappoint
Contraty to the previously mentioned statistics, Bitcoin whales, holders of more than 100K BTC seem to keep their liking toward the top cryptocurrency, at least per the Santiment’s Supply Distribution data. The same suggests the major players’ defense of the BTC prices and justify the latest trading within the range.

As per the latest Santiment data on BTC Supply Distribution per the Balance of Addresses, retail buying, holding less than 10 BTC, has been edging lower since early June, recently to 3.44 million, whereas the whales wallets holding more than 100K BTC defend the recovery in buying from July 14 to 642K.
Additional Catalysts
Apart from the aforementioned catalysts, caution ahead of the July 30 White House Crypto Report, month-end consolidation, and U.S. political tensions—including trade tariff jitters and Donald Trump’s stance on the Ukraine-Russia war and Iran—challenge BTC/USD buyers.
However, strong BTC treasury activity from firms like Strategy and World Liberty Financial, growing confidence after the GENIUS Bill and other crypto legislation during “Crypto Week,” and Bitcoin’s positive correlation with equities continue to support bullish sentiment.
Technical Analysis
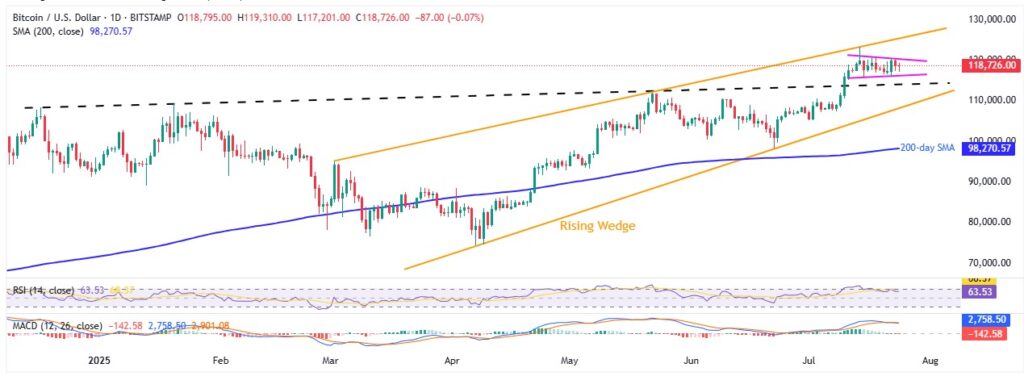
As per the daily chart of Bitcoin (BTC/USD), the crypto leader trades sideways within a two-week range of $116,000–$120,500 after breaking above a key resistance line from mid-December.
The 14-day Relative Strength Index (RSI) and Moving Average Convergence Divergence (MACD) stay neutral, supporting ongoing consolidation within a broader bearish “Rising Wedge” pattern between $108,000 and $126,000.
BTC/USD: Daily Chart Suggests Bullish Consolidation

If Bitcoin (BTC/USD) breaks above the $120,500 resistance, it may climb toward the Rising Wedge top near $126,000 before another consolidation. A breakout beyond that would invalidate the bearish pattern and open the door to the widely discussed $135,000 target, aligned with the ascending resistance from March 2024.
On the flip side, a drop below $116,000 could pull BTC toward the wedge’s base near $108,000, and a break below that would confirm a bearish move with a theoretical target of $60,000—though the 200-day Simple Moving Average (SMA) at $98,270 and April’s low of $74,600 may offer strong support.
Conclusion
Bitcoin (BTC/USD) stays in consolidation mode as traders weigh profit-taking, stalled ETF inflows, and caution ahead of the White House crypto report. While short-term pressure persists, strong whale activity, institutional interest, and broader crypto optimism continue to support the bullish outlook in the medium term.


