
- Bitcoin price rebounds from six-week low after worst weekly drop since March.
- Middle East fears, fading retail demand, and technicals pressured BTC.
- Whale activity and institutional inflows fuel BTC/USD’s bounce from 100-day EMA.
- BTC recovery aims for $110K, but $113K remains the real hurdle for bulls.
Bitcoin (BTC/USD) rebounds from six-week low after worst weekly slump since March, trades near $102,000 during Monday’s European session.
With this, the BTC is up 1.0% intraday, attempting a recovery after posting its steepest weekly decline since late March. That said, the selloff was driven by rising geopolitical tensions, including confirmed reports over the weekend of the U.S. threatening to strike Iranian nuclear facilities. In response, Iran warned it could block the Strait of Hormuz and potentially attack Washington if the U.S. intervenes in its conflict with Israel. This escalation, coupled with a stronger U.S. Dollar (USD) and increased uncertainty among crypto market participants, heavily pressured Bitcoin prices last week.
However, the current BTC/USD rebound is supported by a shift in market sentiment, with investors reassessing geopolitical risks from the Middle East. Additionally, strong demand from large holders (“whales”) and institutional investors—particularly through spot Exchange-Traded Funds (ETFs)—is helping to lift BTC. On the technical side, support from the 100-day Exponential Moving Average (EMA) further strengthens hopes for a sustained recovery.
Geopolitical tensions, trade deadlocks weigh on Bitcoin
Despite President Trump’s recent reassurance, Sunday’s attacks on Iranian nuclear sites and Iran’s “it’s our turn” response have raised fears of a wider Middle East conflict. Iran’s threat to block the Strait of Hormuz adds tension, though markets doubt it can sustain the blockade for long.
Meanwhile, stalled U.S. trade talks and weak economic data, combined with cautious Federal Reserve (Fed) comments, have also weighed on sentiment.
Additionally, markets remain cautious ahead of key events this week, including June Purchasing Managers’ Index (PMI) data, Fed Chair Jerome Powell’s testimony, Core Personal Consumption Expenditures (PCE), Durable Goods Orders, and first-quarter Gross Domestic Product (GDP). This keeps the U.S. Dollar firm and puts pressure on risk assets like cryptocurrencies.
Retail Vs. Institutional Play
Souring market sentiment and a stronger U.S. Dollar (USD) have prompted retail traders to liquidate positions and exit riskier assets, including Bitcoin (BTC/USD). In contrast, large holders—commonly referred to as “whales”—and institutional investors, such as those operating through Exchange-Traded Funds (ETFs), maintained their bullish stance. However, their support wasn’t enough to prevent short-term declines in BTC/USD prices.
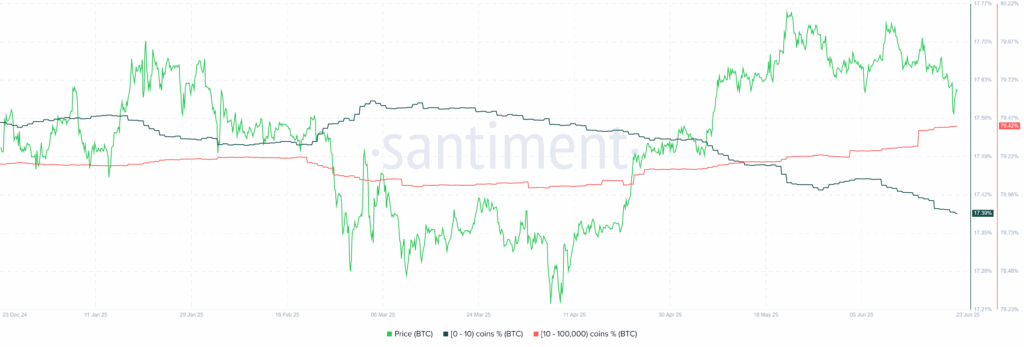
Notably, the growing divergence between retail and institutional holdings may signal a potential short-term bottom for Bitcoin. As shown in the following chart from Santiment, Bitcoin supply distribution by address balance reveals fading retail activity (addresses holding less than 10 BTC) and consistent accumulation by whales (holding between 10 and 10,000 BTC).
BTC Supply Distribution by Balance of Addresses
Source: Santiment
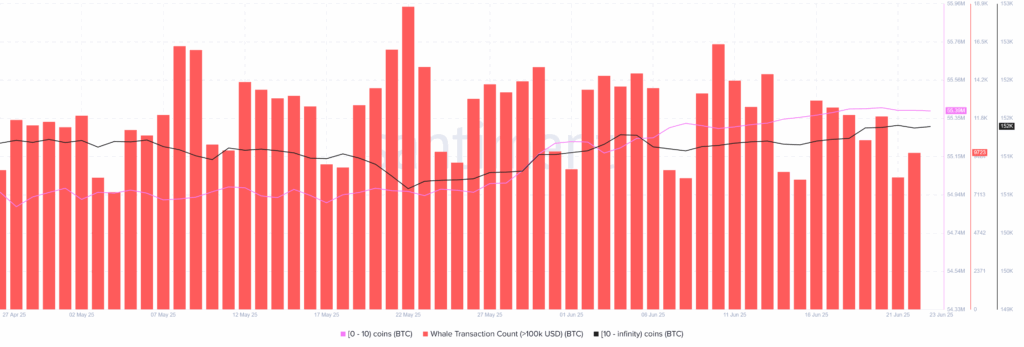
Looking at Bitcoin’s supply distribution by number of addresses, whales continue to maintain a bullish bias—even as the number of whale transactions trends lower. Notably, after selling nearly 30,000 BTC following the June 3 peak, whales reversed course over the past 10 days (through June 19), accumulating approximately 15,000 BTC.
BTC Supply Distribution by Number of Addresses
Source: Santiment
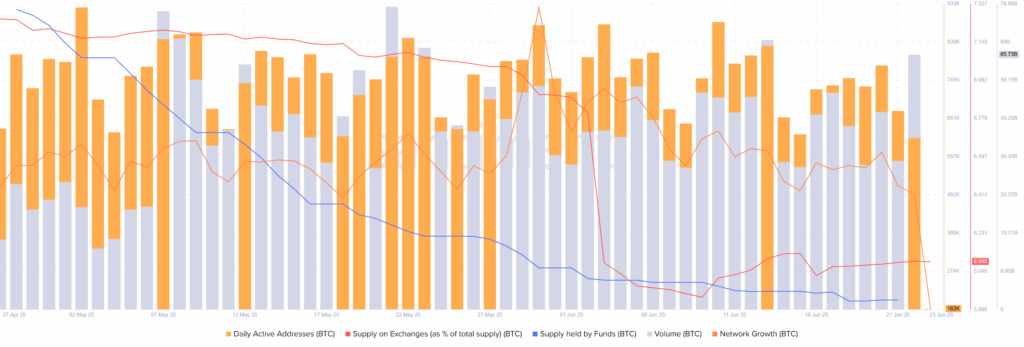
Meanwhile, another chart from Santiment highlights several encouraging on-chain metrics for Bitcoin. These include a rise in daily active addresses, higher trading volume, declining exchange supply (as a percentage of total supply), reduced supply held by funds, and increased network growth. Overall, these signals suggest that the broader bullish trend for the crypto major remains intact, with no clear signs of a major shift in sentiment.
Key BTC On-Chain Signals
Source: Santiment
ETF buyers remain hopeful
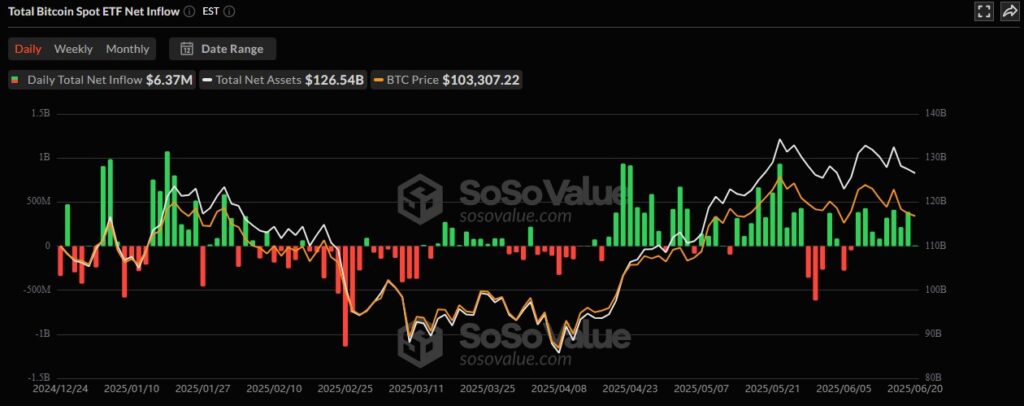
Despite fading retail interest and mixed on-chain signals, institutional demand for Bitcoin remains strong. According to SoSoValue’s Bitcoin spot ETF tracker, there have been nine consecutive days of inflows, totaling nearly $2 billion. This sustained institutional buying continues to support bullish sentiment in BTC/USD.
Source: SoSoValue.com
Short-Term Traders’ Profitability Drops
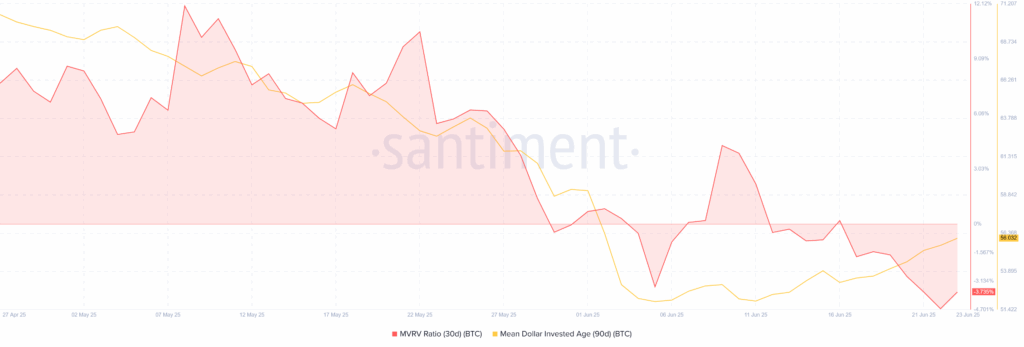
On a different note, Santiment’s MVRV (Market Value to Realized Value) ratio indicates that short-term traders have been operating at a loss over the past 30 days, on average. However, the Mean Dollar Invested Age (MDIA) has been rising over the 90-day average, signaling strong long-term holding behavior. This points to a short-term bearish bias, while the broader bullish trend remains intact.
Source: Santiment
Technical Analysis
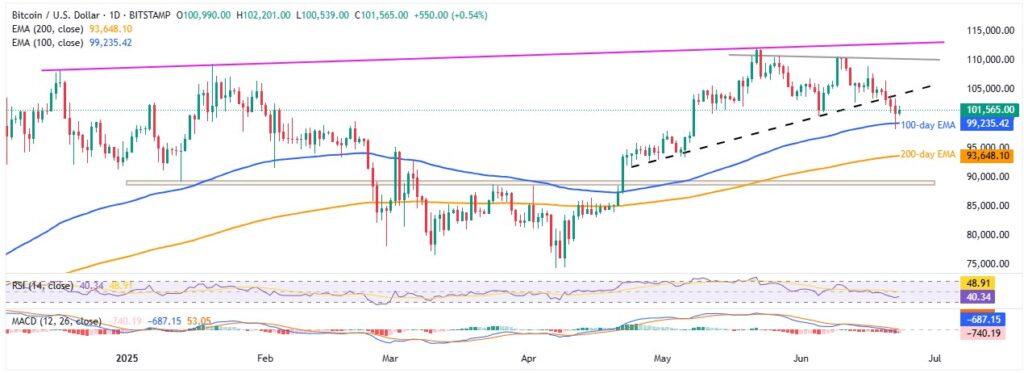
While fundamental and on-chain metrics offer mixed signals, Bitcoin’s (BTC/USD) daily chart points to a potential short-term recovery. However, for the broader bullish trend to resume, BTC/USD must break above the key resistance at $113,000.
BTC/USD: Daily Chart Points To Short-Term Rebound
Source: TradingView
Bitcoin (BTC/USD) is rebounding from the 100-day Exponential Moving Average (EMA) near $99,230, despite the Moving Average Convergence Divergence (MACD) flashing bearish signals. Notably, the 14-day Relative Strength Index (RSI) remains below the 50.00 mark and is trending lower—indicating limited support for further downside and favoring the current recovery.
In the near term, BTC buyers appear positioned to test the former two-month support-turned-resistance around $104,300. However, a descending trendline from May 21, currently near $110,400, may cap further gains. A clear break above this barrier could expose the final key resistance near $113,000—an ascending trendline from late 2024—which serves as the bulls’ gateway to reclaiming broader control.
On the flip side, if BTC/USD fails to hold above the 100-day EMA, support lies at the 200-day EMA around $93,650. Further downside could test a strong horizontal zone formed since mid-January, between $88,700 and $89,000—likely to act as a major support floor for now.
Conclusion
While Bitcoin (BTC/USD) faces mixed signals across fundamentals and on-chain data, institutional interest—evidenced by consistent inflows into spot Exchange-Traded Funds (ETFs)—continues to offer crucial support. Retail participation remains subdued, but whale accumulation and resilient long-term holding trends suggest underlying strength in the broader bullish outlook.
Though short-term volatility may persist amid geopolitical tensions and macroeconomic uncertainty, Bitcoin’s recent rebound from key technical levels reinforces the idea that downside may be limited for now. Traders will be closely watching whether BTC can build enough momentum to reclaim critical resistance levels and confirm a sustainable recovery in the sessions ahead.


