Summary
- Cryptocurrency markets witnessed consolidation amid easy ETF inflows, firmer US Dollar and rising macro fears.
- Bitcoin, Ethereum and Ripple all saw weekly losses, with XRP’s fall grabbing more attention.
- Trump’s steep tariffs, weak U.S. NFP, Fed’s hawkish halt and a halt in ETF inflows pressured major cryptocurrencies.
- On-chain signals suggest ETH and XRP hold an edge over BTC as markets may recover amid a quieter economic calendar.
Cryptocurrency’s weekly performance showed a much-anticipated selling pressure as a firmer U.S. Dollar, a pullback in Exchange-Traded Fund (ETF) inflows, and lackluster U.S. crypto developments triggered a needed consolidation at the end of July and early August.
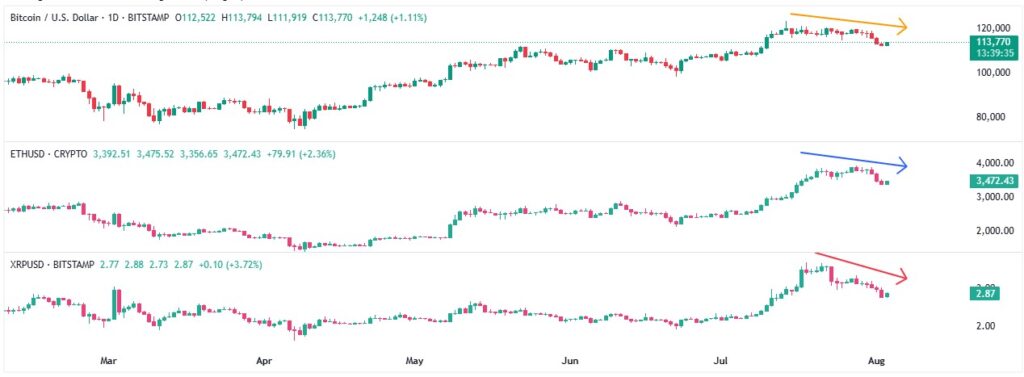
Bitcoin (BTC/USD) price fell over 4.0% last week, its biggest weekly loss since early March. Ethereum’s (ETH/USD) price snapped a five-week uptrend with over 10.0% weekly loss.
Ripple (XRP/USD) price posted a two-week downtrend with the 11.35% weekly drop, the heaviest in five months. It should be observed that the BTC, ETH, and XRP all printed a recovery on Sunday around $114,000, $3,490, and $2.88 in that order.
Key Macro Catalysts
The last week of July, including the first few days of August, offered heavy market volatility as the key U.S. data and global events joined fresh political moves from U.S. President Donald Trump.
Earlier in the week, the United States’ second-quarter (Q2) Gross Domestic Product (GDP) came in stronger than expected, supporting the U.S. Dollar amid the early signs of strength in U.S. employment data. Also boosting the greenback was the Federal Reserve’s (Fed) decision to maintain interest rates in a hawkish hold, showing little inclination to cut rates despite pressure from President Trump. The Fed cited its continued reliance on incoming economic data to justify the decision.
The U.S. dollar rally, however, paused during the midweek as the U.S. Core Personal Consumption Expenditures (PCE) Price Index, also known as the Federal Reserve’s preferred inflation gauge, came in near the downbeat expectations.
Actual plays, however, took place on Friday when the U.S. Dollar Index (DXY) posted its biggest daily loss since April 10. The DXY’s drop followed the release of the July Nonfarm Payrolls (NFP), which disappointed markets with weaker-than-expected figures, aided by an unimpressive outcome from other U.S. employment data for July.
Following the data, President Trump criticized the Fed while taking to his Truth Social account to call Chair Jerome Powell “Too Late Powell.” He also reiterated his call for immediate interest rate cuts.
In a major geopolitical and trade development, President Trump announced steep tariffs on Canada, Switzerland, and India just before the July 30 deadline for trade talks. With this move, nearly 50 countries are now facing significant U.S. tariffs. Trump said these nations could still receive concessions if they agreed to reopen trade negotiations. He also issued a strong warning to countries maintaining trade ties with Russia, threatening heavy tariffs unless Russia agreed to a peace deal with Ukraine within 10 days. Trump cited this as the reason for imposing tariffs on India.
Additionally, U.S. President Trump also sounded tough while expressing his dislike of the nuclear activities in both North Korea and Iran on Truth Social. The Republican leader also criticized North Korea and Iran’s resistance to the U.S. demands and warned them.
The International Monetary Fund (IMF) also signalled a positive economic scenario in its latest global growth forecasts for 2025 and 2026, but failed to impress markets. In doing so, the IMF also raised the GDP projections for the U.S., Europe, and China, reflecting an optimistic outlook for the top-tier global economies.
Crypto Market News
In the cryptocurrency markets, the White House unveiled its much-awaited “Crypto Policy Report,” which aimed to push for stronger digital asset legislation after a 180-day review period. The report encouraged the U.S. Congress to create more regulatory clarity and called on regulators to introduce exemptions that support innovation. The move was seen as an effort to reinforce Donald Trump’s “pro-crypto” stance. It’s worth noting, however, that the report failed to impress crypto optimists, as it lacked direct references to the Bitcoin and Ethereum reserve or guidance on digital asset reserves, as well as offering little confidence to major crypto investors.
Alternatively, the U.S. Securities and Exchange Commission (SEC) unveiled a rule allowing authorized participants to redeem Exchange-Traded Product (ETP) shares directly for the underlying crypto assets rather than settle in cash. On the same line, SEC Chairman Paul Atkins also announced “Project Crypto,” a Commission-wide initiative targeting modernization of the securities regulation and transitioning the U.S. markets to an on-chain infrastructure. This announcement helped the crypto community to offset some of the disappointment from the White House’s policy report.
Additionally, the pro-crypto firm Strategy (formerly MicroStrategy) continued accumulating its Bitcoin (BTC) reserves. The firm’s latest results also marked stellar crypto Treasury and upbeat results, which in turn keep buyers optimistic about the long-term potential of digital assets.
Having discussed the overall market performance and major crypto drivers, let’s focus on the individual cryptocurrencies.
Bitcoin Follows Weaker Equities Amid Surprise ETF Outflows
Bitcoin (BTC/USD) dropped for six out of seven days in the last week as market sentiment soured amid the trade/political pressure and pushed traders off the riskier assets like BTC. Also weighing on the crypto major prices is a halt in the U.S. spot Exchange Traded Fund (ETF) inflows and a weak performance of the U.S. equities, with which the BTC has a linear correlation. Additionally, the White House Crypto Policy Report’s concentration on XRP, Solana (SOL), and Cardano (ADA) in the crypto reserve discussion also allowed the BTC/USD pair to pare heavy gains of July.
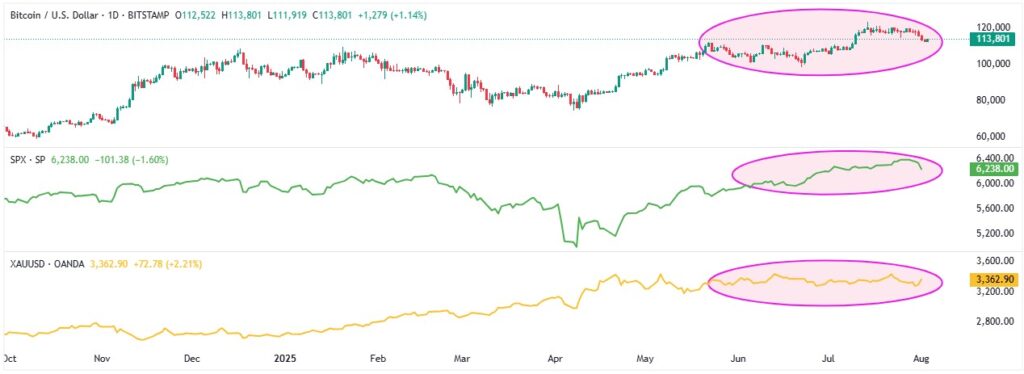
Starting with the correlation chart from TradingView, Bitcoin (BTC/USD) tracked the S&P 500 closely last week but ended up with its biggest weekly loss since early March. The S&P 500, after a strong start and a record high of 6,427, failed to hold gains and closed the week down over 2% at 6,238.
Gold (XAU/USD) took a different path. It posted weekly gains, finishing around $3,362, thanks largely to a 2% surge on Friday, fueled by the market’s disappointment with the U.S. jobs data.
BTC, S&P 500 and Gold
ETF Signals, On-Chain Developments
Starting with the latest U.S. spot Exchange Traded Fund (ETF) data from the SoSoValue, the Bitcoin (BTC) spot ETFs recorded a major outflow of -$812.25 million on Friday, August 1, the largest single-day loss since February 25, 2025. It was also the second consecutive daily outflow, dragging the weekly total to -$643.04 million, the first weekly outflow since early July and the biggest since April.
Still, BTC ETF’s figures for July were strong overall, with $6.02 billion in inflows, marking a four-month uptrend and the highest monthly figure since November 2024.
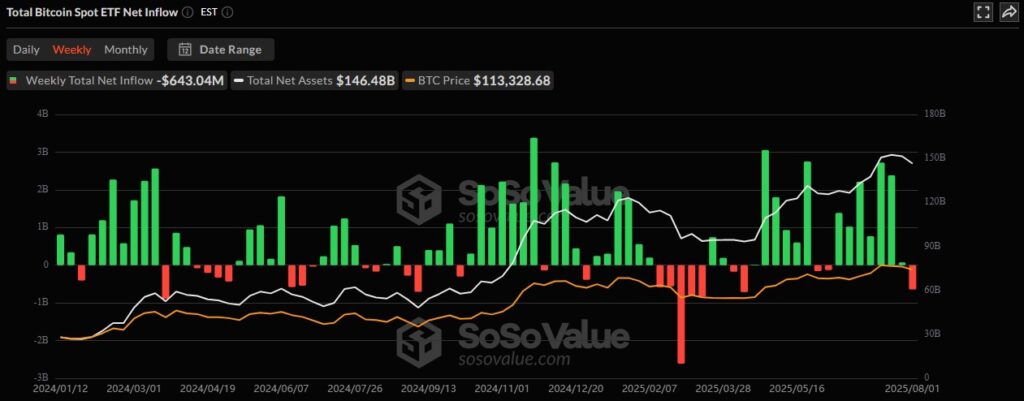
With this magnitude of surprise from the ETF flows, a pullback in the BTC/USD prices was justifiable. However, this doesn’t signal the start of a bearish BTC/USD trend unless the outflows continue in the coming sessions.
Bitcoin Whales Turned Cautious
Bitcoin whales (wallets holding more than 10K BTC) also showed mixed performance, and allowed the BTC/USD pair buyers to catch a breather.
Santiment mentioned an on-chain transaction suggesting a single wallet moving 17,228 BTC, the second-largest transaction of July, following a July 16 transaction showing a 77,446 BTC transfer when Bitcoin hit its all-time high. Alternatively, CEO of Blockstream Adam Back said on X (formerly Twitter) that a whale has been steadily accumulating around 300 BTC per day using a Time-Weighted Average Price (TWAP) strategy. Blockstream’s Back also mentioned that the activity mirrors February’s aggressive run, when the same whale was accumulating up to 1,000 BTC per day.
Also read: Bitcoin Fell Below $115K Post-NFP Data and Tariff’s Shock
BTC MDIA Shows Glimmer of Hope
Bitcoin may be consolidating, but the market remains liquid and stable. The Mean Dollar Invested Age (MDIA) from Santiment supports this, showing a long-term downtrend since early 2025. A falling MDIA indicates that older coins are resuming movement, signaling healthy market activity.

The Age Consumed metric, which tracks idle coins suddenly moving, also points to stability. While MDIA briefly rose to a two-week high as BTC fell in late July, Age Consumed has edged lower, suggesting no abnormal spikes or liquidity stress.
Together, these signs indicate a market with steady momentum and strong liquidity despite recent price pullbacks.
Technical Analysis Lures BTC Bears
Be it a five-month-old “Rising Wedge” bearish chart formation or Bitcoin’s latest dip beneath the previous resistance line stretched from December 2024, the BTC/USD pair sellers are likely gaining interest of late. Adding strength to the downside bias is the 14-day Relative Strength Index (RSI) that stays well beyond the oversold territory and bearish signals from the Moving Average Convergence Divergence (MACD).
Bitcoin Price: Daily Chart Suggests Bullish Consolidation
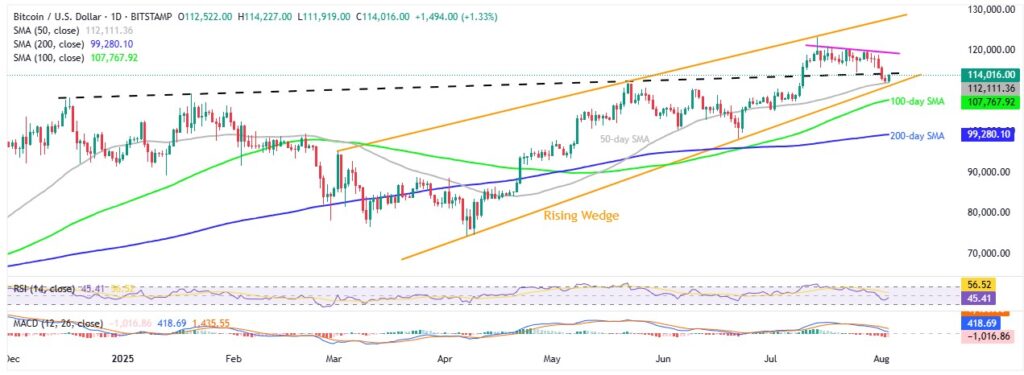
Even if the BTC price bounces off the 50-day Simple Moving Average (SMA), it needs to provide a daily closing beyond the aforementioned multi-month resistance line surrounding $114,400 by the press time. Still, a three-week-old descending resistance line, close to the $120K threshold, will act as the final defense of the BTC/USD bears before giving control to the buyers.
In that case, the following upside momentum could initially eye the all-time high of $123,236 before the upper boundary of the rising wedge, around $128,000 at the latest.
Meanwhile, a downside break of the 50-day SMA support of $112,120 will need validation from the stated wedge’s bottom line surrounding $111,300 to convince sellers. It should be noted that Bitcoin’s sustained selling past $111,300 will confirm the rising wedge bearish chart pattern, suggesting a theoretical target of $61,000. However, the 100-day and 200-day SMAs, respectively near $107,800 and $99,300, will precede the late March swing high surrounding $89,000 and the yearly low of $74,434 to challenge the bears along the way.
Ethereum Buyers Still Have Hopes
Even if Ethereum (ETH/USD) dropped more than Bitcoin, it does have comparatively better ETF positions and on-chain signals, not to forget the network’s wider reach, making it more lucrative than BTC. It should be noted that Ethereum’s 10th yearly anniversary also marked optimism among the ETH buyers amid hopes of more institutional demand fueling the prices.
ETH ETFs Attract Inflows Despite Recent Pullback
As per the latest SoSoValue data, Ethereum (ETH) spot ETFs also witnessed outflow pressure on Friday. Even so, the weekly and monthly figures kept the ETH buyers hopeful.
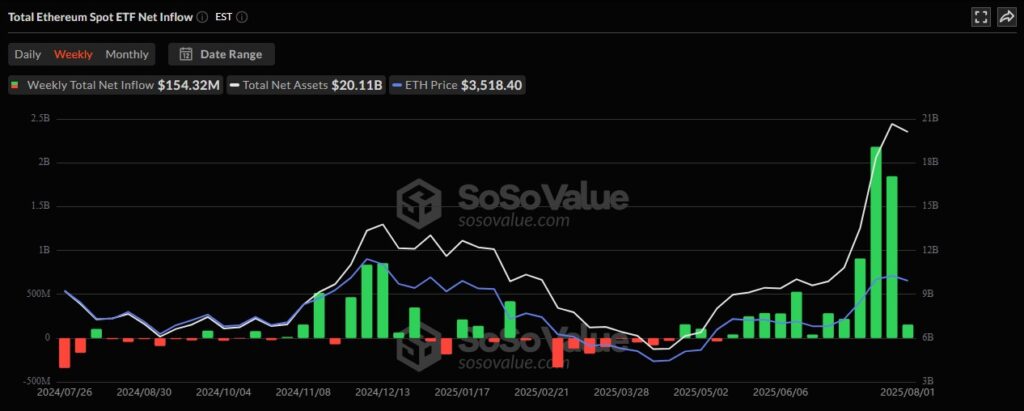
On August 1, the U.S. Spot ETH ETFs reported an outflow of $152.26 million, the first since July 2 and the largest daily outflow since January 8, 2025.
However, the weekly ETH ETF flows remained positive for the 12th consecutive week, totalling $154.32 million. Meanwhile, July also saw a record-breaking $5.43 billion in the U.S. spot ETH ETF inflows, extending its four-month uptrend.
ETH Daily Active Addresses Mark Network Strength
Ethereum’s network activity is on the rise, with Daily Active Addresses (DAA) hitting a one-year high, according to Santiment. DAA measures the number of unique wallets transacting daily — a key indicator of user engagement and network utility.
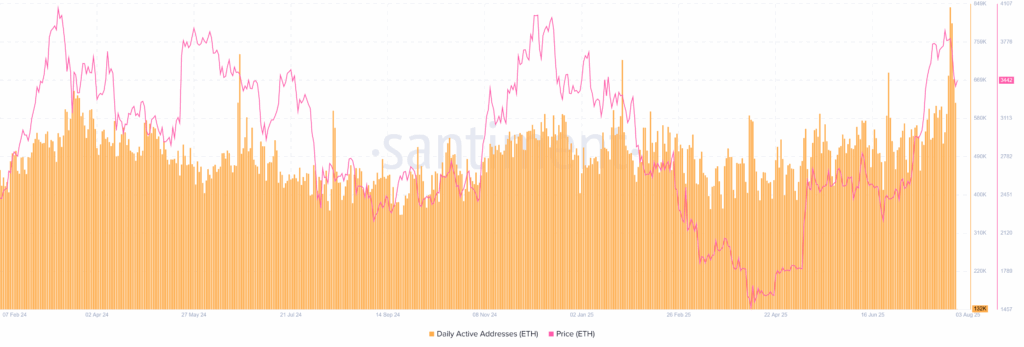
Ethereum added over one million new addresses, highlighting real adoption despite a price drop in the previous week.
According to Santiment’s latest ETH Price and DAA data, the Daily Active Addresses count reached 616.91K.
With this, even with recent price pullbacks, the surge in active users suggests growing confidence in Ethereum’s long-term potential.
ETH/BTC Chart Favors Ethereum Buyers
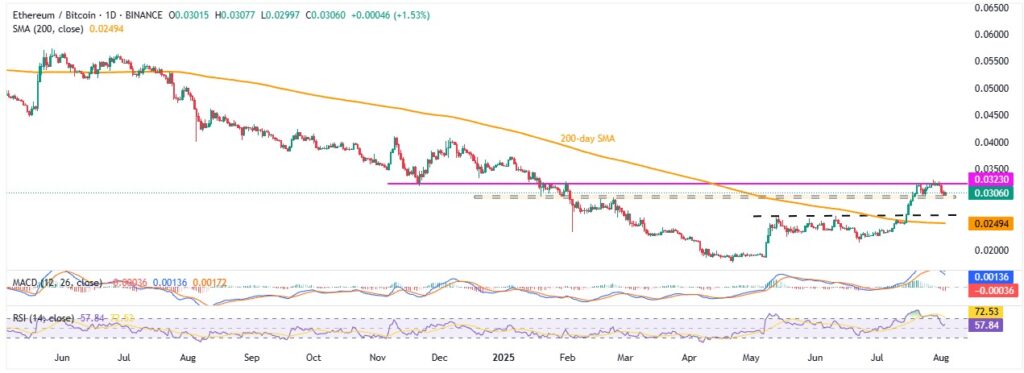
Ethereum bulls retreated from an eight-month-old resistance before bouncing off a horizontal support zone established since mid-January. However, a sustained break above the 200-day Simple Moving Average (SMA) and key resistance levels from both May and January keep the buyers hopeful. The same, in turn, suggests that Ethereum witnessed a pullback but is back to challenging the key resistance.
That said, the ETH/BTC ratio seesaws around the multi-month support zone surrounding 0.0305-0.0295. However, the RSI conditions aren’t bearish, like the MACD signals, which in turn suggest recovery in the ratio and a comparatively firmer price recovery of the Ethereum. It should be noted, however, that the key 0.03230 horizontal hurdle comprising levels marked since late 2024 will be a crucial hurdle, a break of which could trigger the quote’s stellar run-up.
Ethereum Technical Analysis Pokes Bulls
Unlike the ETF, DAA, and ETH/BTC chart, the Ethereum’s (ETH/USD) daily chart shows rising odds for witnessing the second-largest crypto’s further weakness. However, the overall bullish trend is likely to prevail.
Ethereum Price: Daily Chart Signals Further Pullback
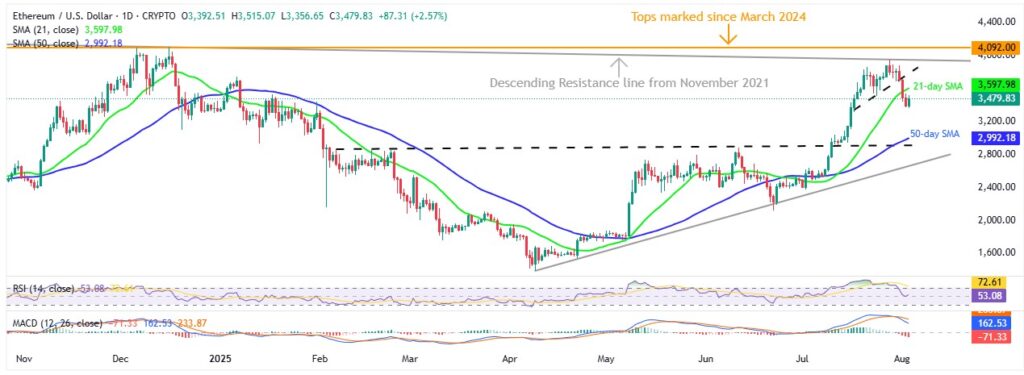
A clear downside break of a fortnight-old support and the 21-day SMA joins an absence of the oversold RSI and bearish MACD signals to suggest short-term downside in the ETH/USD pair.
However, the 50-day SMA support of $2,992 precedes the previous resistance line from February, close to $2,900 by the press time, to challenge the ETH bears. Following that, an ascending support line from April, near $2,660, acts as the final defense of the ETH bulls.
Alternatively, ETH rebound needs validation from the 21-day SMA and the immediate support-turned-resistance line, respectively near $3,600 and $3,780, before challenging the multi-month resistance lines surrounding $3,940 and $4,100.
Ripple Justified Warning Signs for Bulls
Whether it was the dip in whale buying (wallets holding over 1 million XRP) or the overheated MVRV (Market Value to Realized Value) ratio, Ripple’s XRP had been flashing early warning signs—and last week’s sharp drop followed through. However, recent on-chain indicators have now returned to more neutral, healthy levels, suggesting the worst may be over and giving XRP buyers a reason to stay hopeful.
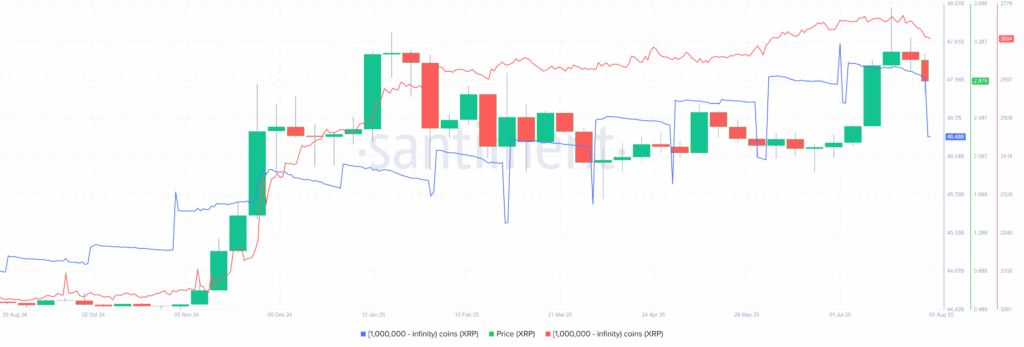
Starting with the XRP whale activity, wallets holding 1 million or more XRP hit a record high of 2,747 earlier in July but retreated to 2,694 by the end of August 03, with these wallets collectively holding roughly $46.48 billion in XRP from $47.59 billion marked on July 01. With this, Ripple buyers show a lack of confidence and challenge further upside in prices, even as the bears are resistant in reclaiming control.
XRP 1M+ Coin Balance By Number & Total Balance Held
Ripple’s MVRV and MDIA Return to Normal
XRP’s 35% price rally in July came with a clear warning that the market was overheating, at least per the Santiment data. The MVRV (Market Value to Realized Value) ratio from Santiment, which compares the current price to the average cost basis of holders, spiked to risky levels when the XRP/USD pair hit a record high.
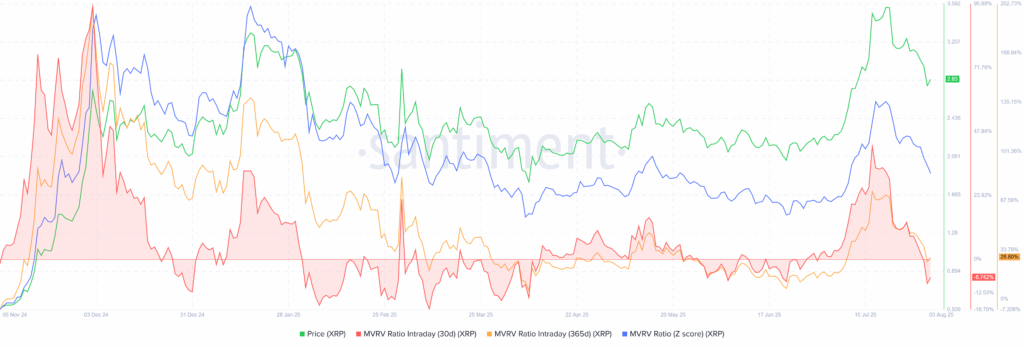
At its top, the XRP’s 365-day MVRV surged above +70%, showing most holders were deep in profit. Such elevated MVRV levels often signal that many investors may start taking profits, increasing the risk of a pullback in prices, which ultimately could be witnessed in Ripple’s performance after it hit the all-time high (ATH). In short, the rally pushed XRP into overvalued territory, and then the consolidation happened. It should be noted that the 30-day MVRV turned negative and suggests a potential pullback for the short term.
That said, the recent consolidation in the MVRV ratio and the XRP prices suggests a potential rebound should the fundamentals support.
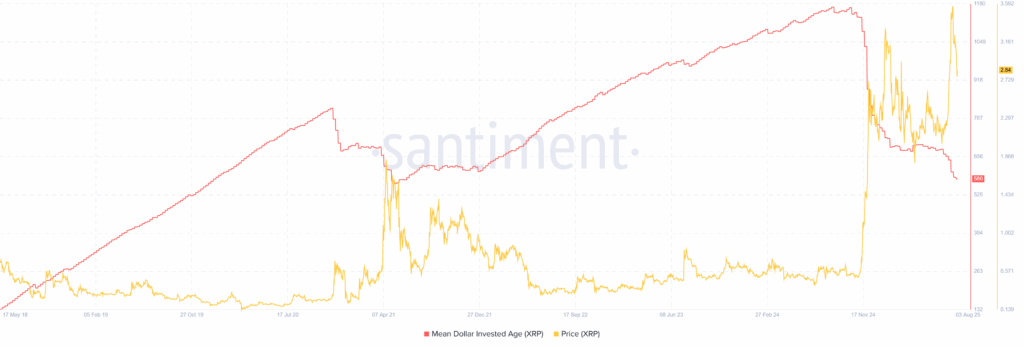
Adding to the optimism is the Mean Dollar Invested Age (MDIA) metric from Santiment, which tracks the average age of invested capital. As per the latest data, the XRP’s MDIA has been in a steady downtrend since early 2025, recently dropping to 580, its lowest level since May 2021. A falling MDIA signals older coins are back in motion, pointing to rising liquidity and healthy market activity.
To sum up, XRP’s July rally and following consolidation in prices join the key on-chain metrics to suggest a potential recovery if the fundamentals align.
XRP Technical Analysis Cites Consolidation
From a technical standpoint, XRP has broken decisively below an eight-month-old broad horizontal support area, now a resistance zone surrounding $2.80-$2.95. The support break also takes clues from the bearish MACD signals and downbeat but not oversold RSI line, which in turn suggests a continuation of the latest weakness in the XRP/USD pair before it hits strong support.
XRP Price: Daily Chart Signals Short-term Weakness
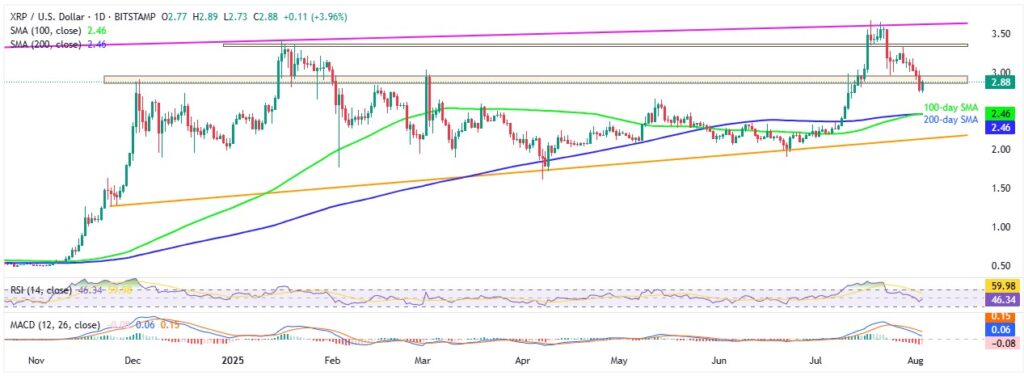
Even if the XRP/USD pair portrays a corrective bounce on Sunday, it needs to provide a daily closing beyond the aforementioned $2.80-$2.95 resistance area to regain the buyer’s attention.
Even so, a horizontal area comprising tops marked since mid-January, near $3.33-$3.36, could test the upside momentum. Beyond that, an ascending trend line from April 2021, near $3.63, and the XRP’s all-time high (ATH) of around $3.66, will be the key resistance to watch for buyers before they aim for the $4.00 threshold.
Meanwhile, a convergence of the 100-day and 200-day SMAs around $2.46-$2.45 appears to be a tough nut to crack for the XRP/USD pair bears. In a case where the Ripple bears manage to conquer the $2.45 support, an ascending trend line from late November, close to $2.15 at the latest, quickly followed by the $2.00 threshold, will act as the final defense of the XRP buyers.
Conclusion
Moving forward, the crypto market may witness consolidation amid a lack of top-tier data/events. Even so, the U.S. Factory Orders, ISM Services PMI, and China’s inflation figures might influence short-term sentiment, especially amid the U.S.-linked trade and political jitters.
It should be noted that the key on-chain metrics portray resilience in Ethereum and XRP, suggesting a recovery in the ETH and XRP prices if broader risk appetite improves. Ethereum’s rising network activity and XRP’s improving Mean Dollar Invested Age (MDIA) signal that both assets could grab the spotlight during a recovery phase.
On the other hand, Bitcoin may witness a more cautious path, mainly due to the recent shift in the ETF flows and broader macro tensions. Even so, optimism around institutional demand, like BTC buying from Strategy, and the potential for a softer U.S. Dollar, mainly due to disappointing Nonfarm Payrolls and Trump’s aggressive tariff stance, could restrict heavy downside in the BTC/USD pair.
Talking about the equities, upcoming earnings results from companies like Eli Lilly, Palantir, McDonald’s, and AMD will be important to watch for narratives. That said, positive results for these top-tier firms would not only help the U.S. stocks recover but could also indirectly support crypto markets.
Given Bitcoin’s positive correlation with the S&P 500, a bullish momentum in equities could spill over into the digital assets, making it an additional catalyst to watch for the crypto traders.
Overall, a slightly less active week is likely to be witnessed ahead. However, surprise changes in the economic data, corporate earnings, and macro signals could increase the volatility of the traditional and crypto markets. Additionally, traders should also observe the on-chain strength in altcoins like Ethereum and XRP, together with the Bitcoin-linked external triggers, for better investment decisions.
Also read: Market Roundup: Gold Rises Nearly 2% as Dollar Dips


