
Cryptocurrency Weekly Summary
- Cryptocurrency weekly trends were downbeat as the Fed rate cut and independence fears joined month-end consolidation.
- Ethereum stalled its three-week uptrend, while Bitcoin and Ripple’s XRP dropped for the third consecutive week.
- CRO and PYTH showed news-driven rallies amid overall crypto market consolidation.
- Mostly upbeat U.S. data, mixed chatter about the Fed’s independence, and Trump-Cook legal drama bolstered Fed fears.
- U.S. court challenges Trump’s tariffs, Russia-Ukraine war intensifies, and Nvidia woes gained attention.
- Market activity may be muted on Monday’s Labor Market Holiday as attention turns to Friday’s U.S. NFP data.
Cryptocurrency Weekly Snapshot
Cryptocurrency markets experienced a downbeat performance last week, coupled with heavy volatility, as early jitters over the Federal Reserve (Fed), be it the rate cut or its independence, joined the month-end positioning of traders. Also, the momentum traders were deterred by grim geopolitical and trade news, contrary to the industry-positive headlines for crypto.
With this, all three key cryptocurrencies, namely the Bitcoin (BTC), Ethereum (ETH), and Ripple (XRP), reported a weekly loss. That said, Ethereum (ETH) paused its three-week uptrend and raised concerns of a deeper fall, whereas BTC and XRP dropped for the third consecutive week.
Bitcoin Sellers Tighten Grips: Bitcoin (BTC) dropped during three of the last seven days, with sharp drops on Monday and Friday dragging it down over 4% for the week. This marks the crypto major’s third consecutive weekly loss, even as it stabilizes around $108,500 by press time. Notably, BTC reports the first monthly loss in five despite refreshing the record top earlier in August.
Ethereum Posts Record Top: Ethereum (ETH) gained more attention as it reported the first weekly loss in four, extending last week’s pullback from the all-time high (ATH). That said, the ETH reported 7.0% weekly loss to $4,445 at the latest. Still, the ETH remains firmer for the second consecutive month in August.
Ripple Stays Pressured: Ripple (XRP) dropped for five days in the last week and reported a third consecutive weekly loss as the market continues ignoring upbeat news surrounding Ripple Labs and the XRP universe. With this, the XRP dropped 6.5% on the week to $2.82 as we write, while posting the first monthly loss in three.
The Weekly Moves

Key Macro Catalysts
Volatility surged across financial markets as U.S. data raised doubts about the Federal Reserve’s (Fed) rate cuts past September, but failed to improve the sentiment.
The reason could be linked to a slightly dovish tilt from major Fed officials, a legal showdown between U.S. President Donald Trump and Fed Governor Lisa Cook, and U.S. Vice President citing the need to end the Fed’s independence.
Also exerting downside pressure on the risk appetite were fresh challenges to Trump’s trade tariffs, Nvidia’s downbeat performance, and unimpressive tech sector earnings, as well as the escalating Russia-Ukraine war.
Starting with the data, U.S. economic data came in mostly firmer, but with inflation still sticky, the Federal Reserve’s move past September remains uncertain.
Durable Goods Orders, the Consumer Confidence Index from the Conference Board, and the Richmond Federal Reserve’s Manufacturing Index all came in stronger than many expected. The latest look at the second quarter’s (Q2) U.S. Gross Domestic Product (GDP) also showed more growth than the first estimation. Meanwhile, weekly jobless claims ticked down a bit, pointing to a still-solid job market.
Further, the headline Q2 Personal Consumption Expenditures (PCE) Price Index eased slightly, but the Core PCE—the Fed’s favorite inflation index- matched upbeat market forecast. Further, the Core PCE rose 0.3% monthly and was up 2.9% versus the last year, in line with market expectations.
About the Fed talks, San Francisco Fed’s Mary Daly, Fed Governor Christopher Waller, and New York Fed’s John Williams all sounded more cautious and in favor of the policy normalization.
Elsewhere, U.S. Vice President James David “JD” Vance suggested the end of the Federal Reserve’s independence in an interview with USA Today, stating elected officials, not unelected bureaucrats, should influence monetary policy.
Meanwhile, the U.S. judge has yet to rule on the dismissal of Federal Reserve Governor Lisa Cook. Instead, both parties, namely President Donald Trump and Governor Cook, have been asked to submit further court documents by next Tuesday. The case links to Trump’s decision to fire Cook over an alleged mortgage conspiracy, which she is now challenging through a lawsuit.
Talking about international trade, Trump’s tariff plan took a hit as the U.S. Federal Circuit Court ruled most of his tariffs illegal, saying he misused the International Emergency Economic Powers Act—especially on fentanyl tariffs against Mexico, Canada, and China. The 7-4 ruling is paused until October 14 for appeals and will likely reach the Supreme Court. The case was sent back to the Court of International Trade to decide the scope and if tariffs continue.
Moving on to geopolitics, Russia launched a massive overnight attack on 14 regions of Ukraine using nearly 540 drones and 45 missiles on Friday, Ukrainian President Volodymyr Zelensky said. Ukraine retaliated by striking Russian oil refineries in Krasnodar and Syzran, both targeted before. The attacks come amid ongoing international efforts to secure a peace deal between Ukraine and Russia, and just days after Kyiv, Ukraine’s capital, faced its second-largest aerial strike, killing at least 25 people. Ukraine’s Zelensky urged the United States, Europe, and the world to take action against Russia. That said, European Union foreign ministers are meeting in Denmark this weekend to discuss the war and other global issues.
On Wall Street, earnings from Nvidia, Dell, and Alibaba grabbed attention as the topline figures were not too disturbing but worries over Trump’s tariffs and political tensions played their roles in weighing on sentiment. The Wall Street Journal (WSJ) reported that Alibaba developed a new AI chip to compete with Nvidia in China, showing Beijing’s rush to build its own AI technology and rely less on Nvidia amid the U.S. restrictions.
With this, the U.S. Dollar Index (DXY) surged sharply on Monday but pared most gains afterward, finishing the week with modest upside. Meanwhile, the spot gold (XAU) rose the most on the week since early June. However, U.S. equity benchmarks ended the week with mild losses, weighed down by losses on Monday and Friday, despite modest gains on Tuesday, Wednesday, and Thursday.
Looking forward, the U.S. bourses will be off during Monday’s Labor Day holiday, restricting major market moves. The trading sentiment is also likely to be affected by a light calendar ahead of Friday’s U.S. monthly employment report for August.
Crypto Market News
In the crypto universe, coins like Cronos (CRO) and Pyth Network (PYTH) gained major attention, while striking a stellar move. Notably, CRO jumped over 90% in a week, while PYTH rose around 55% weekly.
Also important to note was a nearly 8% fall in the total market cap despite growing rumors that ETFs for major tokens like Solana, XRP, and Cardano are targeting approval in Q4 2025.
The U.S. Commerce Department partners with the Pyth Network to publish GDP data on the blockchain, which propelled the PYTH price by around 99% on Thursday.
Read Details: Pyth Network Selected to Distribute U.S. Economic Data On-Chain; Token Surges 60%
Meanwhile, the Trump Media and Technology Group (DJT), Yorkville Acquisition, and Crypto.com agreed to form a joint venture, via a first of its kind Cronos (CRO) Treasury Company worth $6.4 billion.
Read Details Here: Trump Media, Crypto.com and Yorkville Announce $6.4 Billion CRO Treasury Strategy; Know The Details
Further, a joint effort from VanEck, Centrifuge, Circle, and WisdomTree, led by Aave Lab, to offer a Horizon platform gained major attention as it unlocks nearly $26 billion of tokenized asset market for decentralized finance (DeFi) lending. The tool also gained support from Chainlink as it will provide real-time Net Asset Value (NAV) data.
Read Details: Aave’s Horizon Platform Unlocks $26B in Tokenized RWAs for Stablecoin Institutional Lending
Elsewhere, the number of corporate Solana (SOL) treasuries has grown to 13, together holding around 8.27 million SOL worth $1.72 billion. The total holdings now constitute 1.44% of Solana’s total supply. Further, the Solana Foundation also offered the community to vote on its Alpenglow upgrade that promises near-instant transaction finality.
On a different page, the crypto industry players pushed the U.S. government towards federal protections for software developers in a letter to the Senate. The details mentioned that nearly 112 cryptocurrency companies, investors, and advocacy organizations, including a16z, Coinbase, and Kraken, wrote to the Senate Banking and Agriculture Committees on August 27. They underlined that federal protections for software developers are essential to the market structure bill’s support.
Follow our Coin Bytes for regular live crypto updates.
The U.S. Commodity Futures Trading Commission (CFTC) opened the door for the offshore crypto exchanges as Foreign Boards of Trade (FBOTs). This opens a huge money flow for the global crypto platforms that couldn’t previously entertain the U.S. customers.
Also read: Offshore Crypto Exchanges are Now Welcome for U.S. Traders per CFTC Advisory
Moving on, Tether, issuer of the largest stablecoin USDT, announced plans to launch the USDT on RGB, a new protocol enabling digital assets on the Bitcoin network, in a move to integrate stablecoins into Bitcoin’s core infrastructure. This will allow users to send and receive USDT alongside Bitcoin in the same wallet, without needing separate blockchains.
Read more: Tether Brings USDT to RGB, Making Bitcoin a Stablecoin Platform
Notably, chatter surrounding the real Satoshi Nakamoto regained life after Hal Finney’s old photo sparked excitement over the Bitcoin creator.
Also read: The Real Satoshi Nakamoto? Hal Finney’s Old Photo Sparks Excitement Over Bitcoin’s Creator
On a cautious note, an Interpol Operation, called Serengeti 2.0, nabbed around 1,200 cybercriminals, shut down nearly 14K harmful crypto mining infrastructure, and recovered $97.00 million during the June and August period across 18 countries in Africa.
Read Details: Epic Interpol Operation Serengeti 2.0 Nabs 1,200 Cybercriminals in Africa-Wide Crackdown
Bitcoin Drops, Equities Edge Lower, But Gold Rallies
Bitcoin (BTC) dropped during three of the last seven days, with sharp drops on Monday and Friday dragging it down over 4% for the week to $108,500 by press time. The crypto leader’s downbeat performance could be linked to jitters over the Federal Reserve (Fed), be it the rate cut or its independence, and the month-end positioning of traders. Also weighing on the BTC were grim geopolitical and trade news, contrary to the industry-positive headlines for crypto.
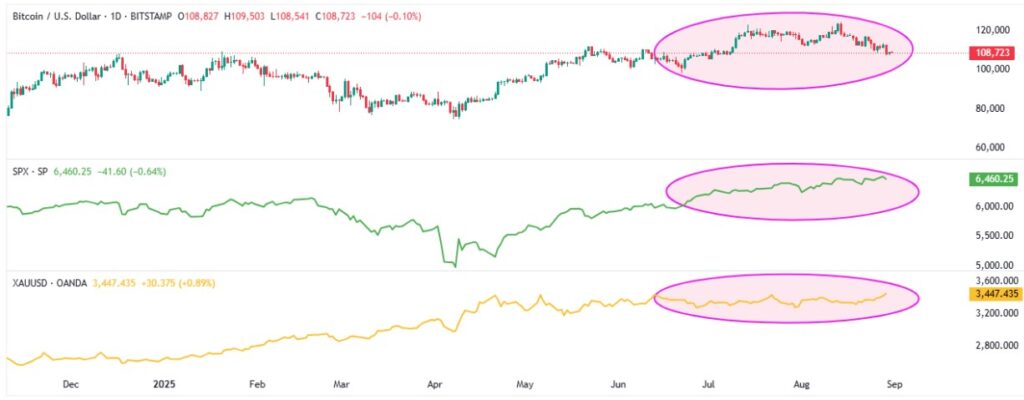
In doing so, the BTC’s downbeat performance deviated from the S&P 500 index, which was mostly flat, down 0.10% weekly. That said, the spot Gold (XAU) posted the biggest weekly jump since early June, up for the second consecutive week, as market players rushed toward the traditional haven amid uncertainty surrounding the Fed, politics and trade.
Let’s start discussing the key BTC moves and data to understand the crypto major’s action.
To begin with the correlation chart from TradingView, Bitcoin (BTC) reported the third weekly loss, but the spot Gold (XAU) was strong and the U.S. equity benchmark S&P 500 reported the modest week-on-week (WoW) loss, all portraying a divergence in the investment pattern.
With this, the BTC traders should stay cautious as the latest data and news leave many questions unanswered. Uncertainties around future Federal Reserve interest rate decisions, concerns over the Fed’s independence, the ongoing Ukraine-Russia war, and the impact of former President Donald Trump’s tariffs all continue to cloud the market outlook.
The S&P 500 approached its ATH on Friday, even as it dropped for three days in the week, reporting a 0.10% weekly loss to 6,460 at the latest.
Gold (XAU/USD) grabbed the buyer’s attention, as it jumped to an 11-week high, up for the second consecutive week, as well as reported the biggest weekly gains since early June, all while ending the week’s trading around $3,448.
BTC, S&P 500 and Gold
ETF Signals, On-Chain Developments Keep BTC Traders Guessing
Starting with the latest U.S. spot Exchange Traded Fund (ETF) data from the SoSoValue, the Bitcoin (BTC) spot ETFs snapped a four-day inflow pattern, before posting a daily outflow of $126.64 million on Friday.
Still, the weekly total net inflow was $440.71 million, reversing the previous week’s heavy losses, which were the biggest weekly outflow in six months.
With this, the monthly BTC ETF outflow figures for August snap the four-month uptrend with an outflow of $751.12 million, the biggest since March, versus July’s $6.02 billion in inflows.
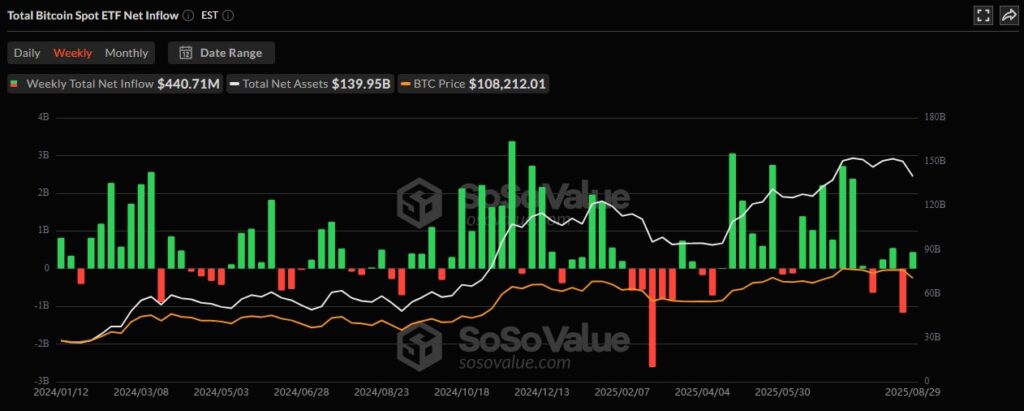
With this magnitude of surprise from the ETF flows on a monthly basis, the first monthly BTC loss in five was justifiable. However, this doesn’t signal the start of a bearish Bitcoin trend unless the outflows continue in the coming sessions.
Bitcoin Whales, MDIA and MVRV Ratio Eyed
Apart from the U.S. spot BTC ETF data, performance of the key wallets, upbeat total funding rates, and the Market Value to Realized Value (MVRV) metric portray warning signs for the the Bitcoin buyers. Meanwhile, the Mean Dollar Invested Age (MDIA), whichtracks the average age of invested capital, suggests further volatility in the market as older Bitcoins are coming to the exchanges.
Bitcoin (BTC) MVRV Data, Total Funding Rates
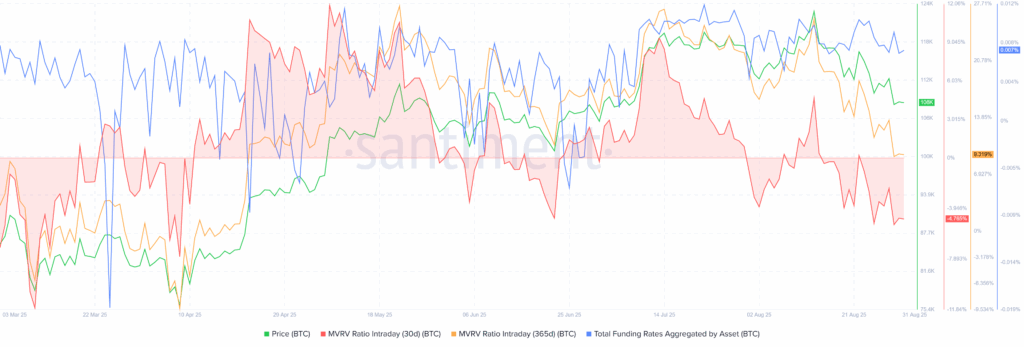
A combined metric showing Bitcoin’s Market Value to Realized Value (MVRV) and Total Funding Rates shows a cautiously optimistic picture.
That said, the MVRV (Market Value to Realized Value) ratio, which compares the current price to the average cost basis of holders, also known as the holder profitability, remains less risky on a long-term basis (over 9.32% on a 365-day basis), while staying downbeat in the short-term (-4.77% on 30-day). This doesn’t exactly portray the overheated market conditions for BTC, even if a slight caution is needed, considering the long-term MVRV.
Elsewhere, the Total Funding Rates Aggregated by BTC, a recurring fee that long positions pay to short positions, or vice versa, at predetermined intervals (usually every 8 hours), per Santiment. With gradually falling funding rates, the metric suggests that traders are turning cautious due to the latest price decline. That said, the cost index dropped 15.47% during the August 25 to 31 period, currently around 0.006786%.
Bitcoin (BTC) MDIA, Daily Active Addresses, and Transaction Volume
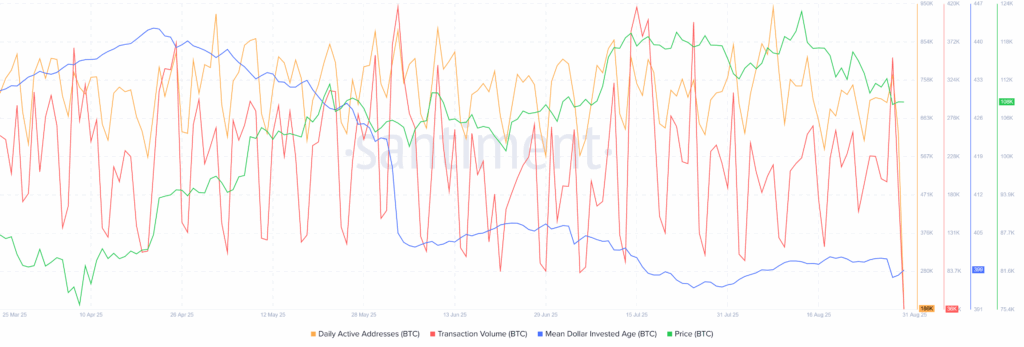
The Mean Dollar Invested Age (MDIA), which tracks the average age of invested capital, suggests further volatility in the Bitcoin prices as older coins are coming to the exchanges. A fall in the MDIA suggests that long-dormant coins are re-entering the circulation channel via exchanges. That said, the BTC’s MDIA has been falling gradually since late April, down 0.46% during the August 25-31 period to 399.13 at the latest.
Meanwhile, Bitcoin’s on-chain activity is picking up. Daily Active Addresses rose by around 9% to 770,000, and Transaction Volume jumped nearly 55% to 353,000 between August 25 and 29, pointing to rising trader participation. Along with the Median Dollar Invested Age (MDIA), these metrics suggest increased volatility ahead. While the direction isn’t confirmed, broader signals from the Federal Reserve and global risk sentiment may guide the next move—potentially to the upside in the long run.
Bitcoin Supply Distribution for August 25-31
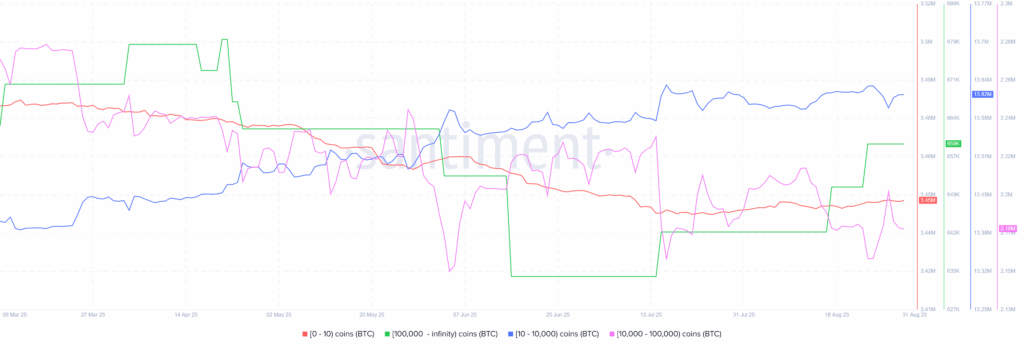
As per the Santiment data for the August 25-31 period, the wallets (addresses) holding 10–10,000 BTC, known as sharks, cut their holdings by 14,781 BTC, marking 0.11% reduction.
On the other hand, the retail wallets (holding 0–10 BTC) added 663.00 BTC (or +0.02% addition), while the whales (wallets with 10,000–100,000 BTC) increased their holdings by 16,687 BTC, or 0.77%, during the said period.
Meanwhile, the wallets with over 100,000 BTC holdings (mega-wallets) reported no change in their holdings during the stated period, currently around 660K BTC.
This suggests active participation in Bitcoin, with large wallet holders (whales) increasing their positions while sharks reducing their exposure. Historically, whale accumulation often signals a potential price recovery, hinting at a possible upside ahead.
Technical Analysis Challenges BTC Bears
As per the BTC’s daily chart, the Moving Average Convergence Divergence (MACD) indicates continued short-term downside pressure. Meanwhile, the 14-day Relative Strength Index (RSI) line, another key momentum indicator, approaches the oversold limit of 30.00, and joins a slew of downside support to raise bars for the BTC bears.
Bitcoin Price: Daily Chart Suggests Short-Term Downside
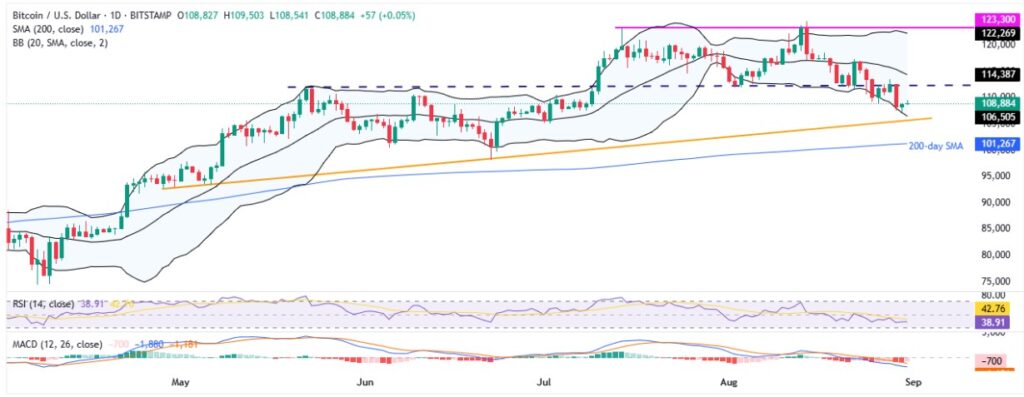
Failure to provide a daily closing beyond a three-month horizontal support, now resistance, joins the bearish MACD signals to favor Bitcoin sellers.
However, the RSI line’s nearness to the oversold boundary and a bounce from the lower Bollinger Band (BB), close to $106,500, could limit immediate BTC downside.
Even if the quote fades the bounce and drops below the lower BB support, an upward-sloping trend line from late April and the 200-day Simple Moving Average (SMA), respectively near $105,500 and $101,260, will act as the final defense of the Bitcoin buyers.
On the flip side, a daily closing beyond the previous support line surrounding $112,500 becomes necessary to allow the BTC buyers to aim for the middle BB surrounding $114,400.
If Bitcoin holds above $114,400, bulls may aim for the $120K mark, with further hurdles at the upper Bollinger Band near $122,300 and key resistance at $123,300, clearing these could pave the way for a new all-time high (ATH), beyond the current top of $124,500.
With the failure to defend $112,500 support, Bitcoin faces short-term downside pressure, despite recent rebound from the lower BB. This highlights the support around $106K. The real test for the BTC buyers is the 200-day SMA; holding this support level of $101,260 is crucial to avoid deeper declines. Traders should watch closely for how BTC reacts around this key support.
Ethereum Pullback Finally Here!
Even if the on-chain data flashes mixed signals, Ethereum’s (ETH) much-awaited pullback is finally here and keeps the sellers on the lookout.
ETH ETFs Regain Inflows
As per the latest SoSoValue data, the U.S. Ethereum (ETH) spot ETFs reversed the previous weekly outflow, which was the first in 15 weeks, even as the daily flows dropped on Friday. That said, ETH ETF inflows reported the first daily outflow in seven on Friday. Still, the weekly and monthly ETH ETF inflows keep the buyers hopeful.
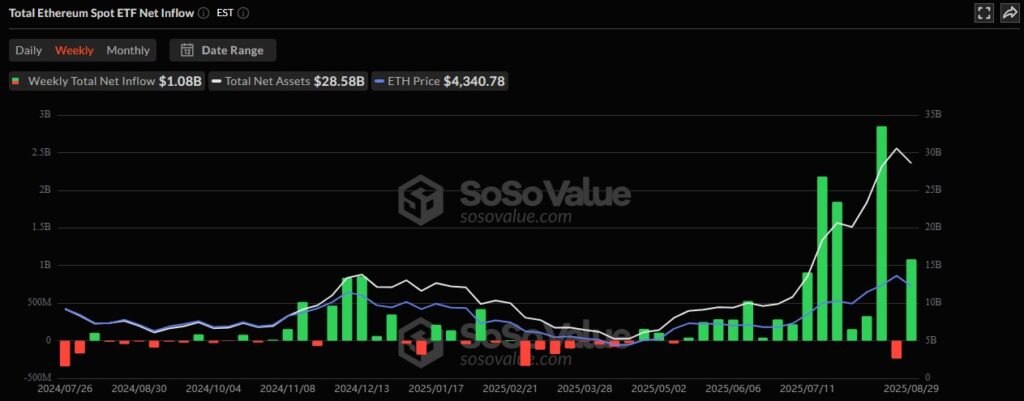
On August 29, the U.S. Spot ETH ETFs reported its first daily inflow in six, with a strong $164.64 million figure.
Still, the weekly ETH ETF flows remain firmer, with a total of $1.08 billion for the week, following the surprising outflow in the previous week.
Meanwhile, August saw a fifth consecutive monthly inflow pattern, with the latest figures being $3.87 billion, versus July’s record inflows of $5.43 billion.
Ethereum On-Chain Data Flashes Mixed Signals
In the case of Ethereum, the supply distribution data signals accumulation by the important wallets and suggest a recovery in price, but other on-chain signals are mixed and challenge the optimists.
Ethereum Supply Distribution for August 25-31
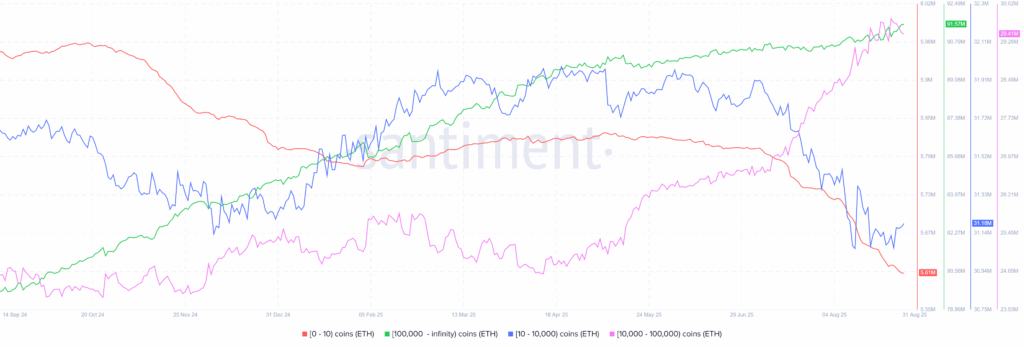
As per the Santiment data for August 25-31, the wallets (addresses) holding 10–10,000 ETH, known as sharks, increased their holdings by 95,721 ETH, marking almost a 0.31% accumulation.
On the other hand, the retail wallets (holding 0–10 ETH) cut their holdings by 10,121 ETH (or -0.18%), while the whales (wallets with 10,000–100,000 ETH) increased their holdings by 139.23K, or –0.48%.
Meanwhile, the mega-wallets, wallets with over 100,000 ETH holdings, reported a notable increase in their holdings, by 124.9K or 0.14% during the stated period, currently around 91.57 million ETH.
Hence, apart from the retail traders, all other wallets have increased their ETH holdings, suggesting a strong confidence in the second-largest crypto.
Furthermore, the MVRV ratio flashes warnings while the total funding rates are positive, but the Mean Dollar Invested Age (MDIA) is dropping sharply. A fall in the MDIA suggests that long-dormant coins are re-entering the circulation channel via exchanges, a signal for heavy volatility for the coin. Additionally, Network Realized Profits are strong, and the Supply on Exchanges continues to fall, suggesting a strong preference for holding the coin, another bullish sign.
Ethereum (ETH) MVRV Data, Total Funding Rates
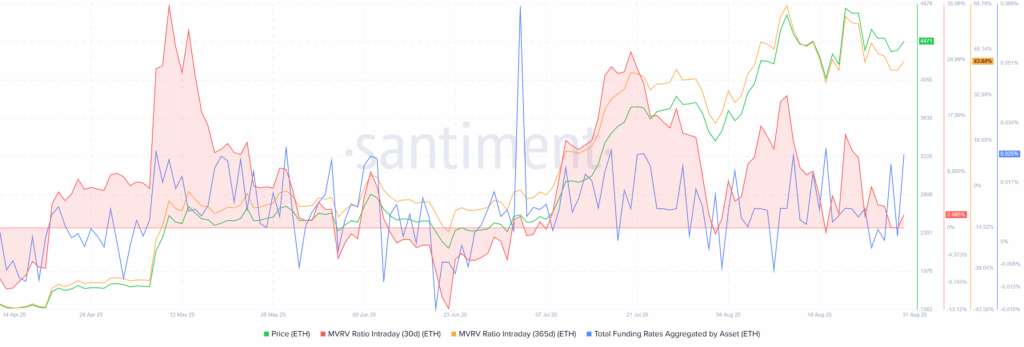
In case of Etehreum, MVRV metric appears more alarming as long-term holders’ profitability remain too high (over 43% on 365-day MVRV), but the short-term holders (30-day MVRV) seem to be posting around 2.10% profitability. Hence, a pullback in the long-term profitability is still a concern for the ETH buyers.
It should be noted that the total funding rates grew 161% during the August 25 to 31 period, currently around 0.025%. This shows the traders’ readiness to pay a higher premium to defend the position, long positions in this case, which in turn suggests increased bullish bias among the traders.
Ethereum (ETH) MDIA, Supply on Exchanges, Network Realized Profits
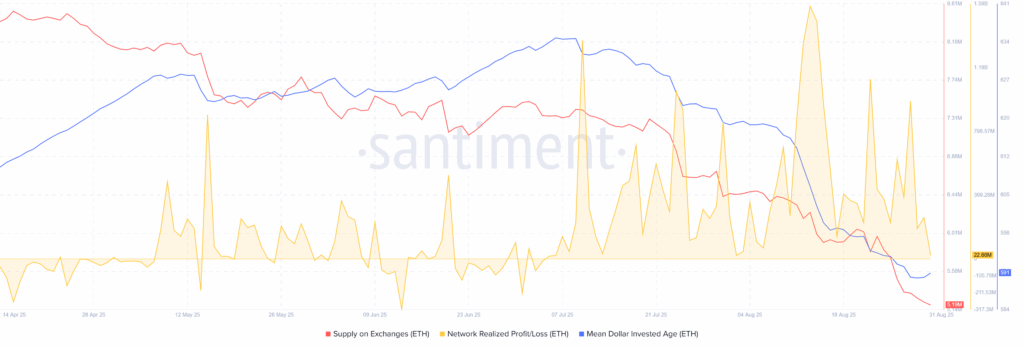
On a different page, Mean Dollar Invested Age, whichtracks the average age of invested capital, dropped over 6.0% since early July, near to the lowest levels in five months surrounding 591 by the press time. On the same line, Supply on Exchanges slumped 30% to 5.19 million. Furthermore, Network Realized Profits marked a disappointment with a 90% loss during the stated period from early July to the August-end, currently around 22.66 million.
These catalysts together suggests a healthy run-up in prices with a slight need for cautious as the Fed’s next move still depends on the data, even if the September rate cut and two more reductions are widely discussed.
Validator Queue Lures ETH Sellers
Ethereum’s validator exit queue an all-time high, raising concerns among crypto optimists. The validator queue data suggests the number of ETHs (by the stakers) requesting to leave/enter the Ethereum’s proof-of-stake system, as well as the likely number of wait period in days due to the processing cap.

The latest validator queue shows that roughly 1.06 million ETHs were lined up to leave the network on Friday, before the recent retreat to 981,762 ETHs. At its peak, the validator exit queue stretched to 19 days before pulling back to 17.
This spike signalled a major shift in the validator behaviour as it shows a rush towards leaving the network despite a slight weakness in the prices.
ETH/BTC Chart Pokes Ethereum Bulls
While the on-chain signals are mixed and the ETF inflows defend optimism, the ETH/BTC ratio faces the key upside hurdle, namely the 100-week SMA. It’s worth noting, however, that the quote’s sustained breakout of a 23-month resistance line keeps the buyers hopeful.
ETH/BTC Ratio: Weekly Chart
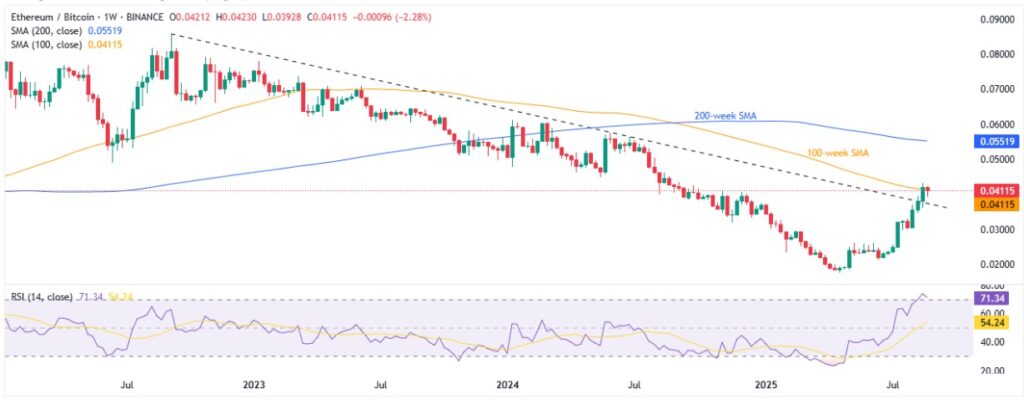
ETH/BTC ratio needs successful trading beyond the 100-week SMA of 0.04115 to keep buyers on board.
However, the 14-Week Relative Strength Index (RSI) is into the overbought territory past the 70.00 threshold, suggesting a pullback in prices.
This highlights the multi-month previous resistance line, close to $0.0370 at the latest, as the decisive level, a downside break of which could trigger the much-awaited pullback in the prices.
Alternatively, an upside clearance of the 0.04115 hurdle comprising the 100-week SMA will open the door for the ETH/BTC ratio’s rally toward the 200-week SMA hurdle of 0.05520 before the yearly high of 0.06117.
Ethereum Technical Analysis Signals Consolidation
Ethereum’s technical analysis suggests a trend-widening formation and continuation of two-month upside. However, the bearish MACD signals and the neutral RSI near 50.00 could join the “rising mehapgone” pattern to offer intermediate pullbacks in the ETH prices, despite the latest corrective bounce.
Ethereum Price: Daily Chart Points To Short-term Pullback
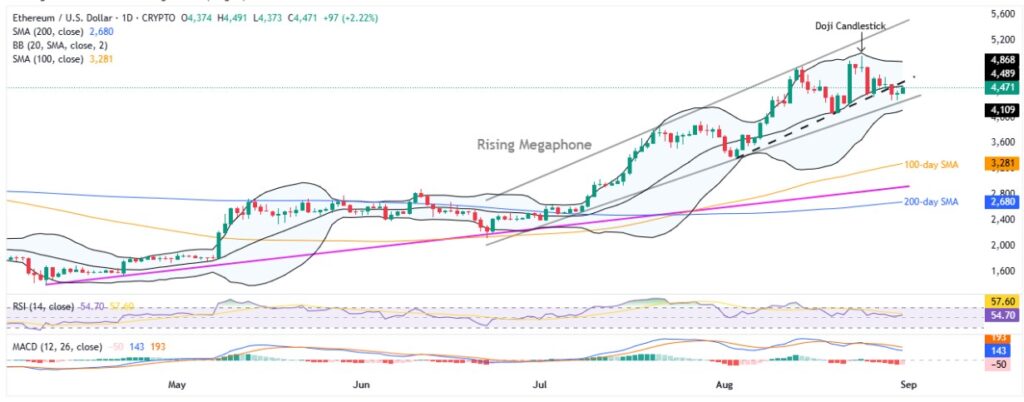
Ethereum’s clear break of a three-week support line joins bearish MACD signals and neutral RSI line, close to the 50.00 level, to suggest a continuation of the short-term downside. Adding strength to the bearish bias is Sunday’s Doji candlestick at the record top.
With this, ETH appears well-set to revisit the bottom line of a seven-week-old “Rising Megaphone” trend-broadening chart pattern, currently around $4,260.
However, the quote’s further weakness appears doubtful, which, if it happens, will be challenged by the lower Bollinger Band (BB) surrounding $4,100 and the $4,000 round figure. In a case where the ETH remains bearish past $4,000, the 100-day SMA and a rising trend line from early April, respectively near $3,281 and $2,900, could lure the sellers.
Above all, the 200-day SMA level of $2,680 appears to be the last line of defense for the ETH buyers.
On the contrary, Ethereum’s latest recovery aims for the middle BB near $4,490, but the support-turned-resistance line from early August, close to $4,870, holds the key to welcoming the buyers.
Beyond that, the August 17 swing high of $4,577 and the early-month peak of $4,782, as well as Sunday’s ATH of $4,954 and the $5,000 psychological magnet, will gain the market’s attention.
Notably, the quote’s sustained trading beyond the $4,954 will defy the bearish candlestick formation and allow buyers to aim for fresh record tops, highlighting the $5,000 round figure, as well as an ascending trend line forming part of a multi-month trend-broadening chart pattern, close to $5,400 at the latest.
Overall, the ETH’s latest pullback in price is likely to prevail but may not challenge the broader bullish outlook.
Ripple Bears Keep The Reins
Ripple (XRP) dropped nearly 6.5% last week, down over 6.0% in August, even as Santiment cites an opinion poll stating 38.6% of respondents believe XRP will have the best performance for the rest of 2025, indicating extreme crowd optimism.
The XRP’s latest pullback could be linked to a likely profit-booking by the long-term buyers, as per the MVRV (Market Value to Realized Value) ratio. However, the whale buying has also been sluggish and suggests a likely continuation of pullback in the prices, whereas the funding rates improved surprisingly, signaling a slight optimism among the buyers.
The MVRV (Market Value to Realized Value) ratio from Santiment, which compares the current price to the average cost basis of holders, spiked to risky levels when the XRP hit a record high, resulting in the following pullback.
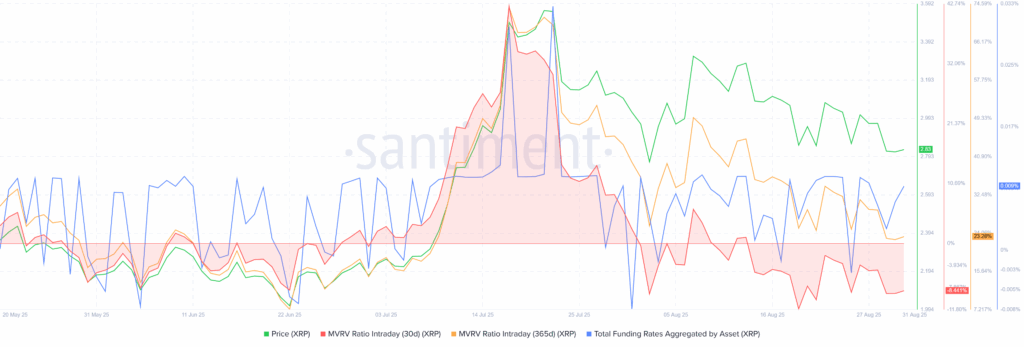
At its top, the XRP’s 365-day MVRV surged above +70% in July before retreating to 23% at the latest, showing most holders are deep in profits despite the retreat. It should be noted that the 30-day MVRV turned negative before improving in the last week from -8.72% to -8.44% at the latest, which in turn suggests a potential pullback for the short-term.
Further, the total funding rates grew from -0.003056% on August 25 to 0.008684% at the latest. This shows the traders’ fresh readiness to pay a higher premium to defend the position, long positions in this case, which in turn suggests fresh optimism among the traders.
Elsewhere, wallets holding 1 million or more XRP, known as whales, hit a record high of 2,749 earlier in July, close to 2,693 by the end of August 30, with these wallets collectively holding roughly $47.42 billion in XRP, down a bit from $47.43 billion marked on August 25. With this, Ripple buyers show slightly upbeat confidence even as the prices are down for the third consecutive week, maybe cause of the resolution of its multi-year battle with the U.S. Securities and Exchange Commission (SEC).
XRP 1M+ Coin Balance By Number & Total Balance Held
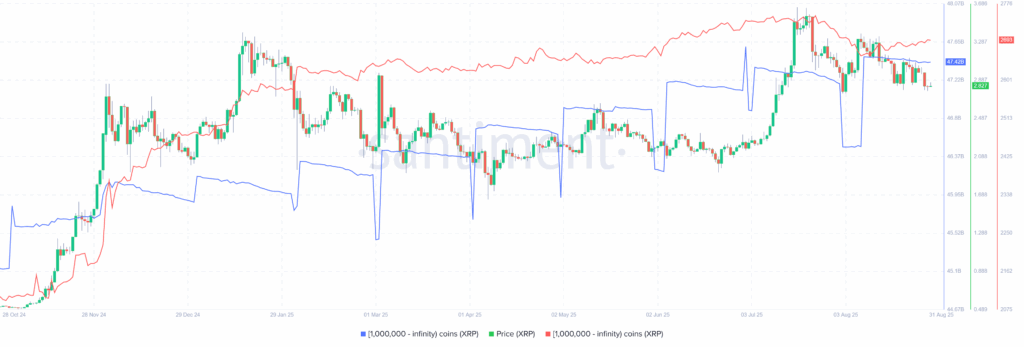
To sum up, the XRP’s MVRV Ratio and wallet performance favor hopes of witnessing a corrective bounce in the price. Overall, the three-week cooling off appears a healthy correction after overheated gains. Still, without strong bullish fundamentals, which seem unlikely for now, the sluggish trend may continue.
Ripple Technical Analysis Suggests Short-Term Consolidation
From a technical standpoint, XRP stays between a seven-month-old broad horizontal resistance zone, surrounding $3.33-$3.36, and the lower BB, close to $2.73. The consolidation bias also takes clues from the nearly oversold 14-day Relative Strength Index (RSI) line and bearish signals from the Moving Average Convergence Divergence (MACD).
Ripple Price: Daily Chart Signals Short-term Rebound
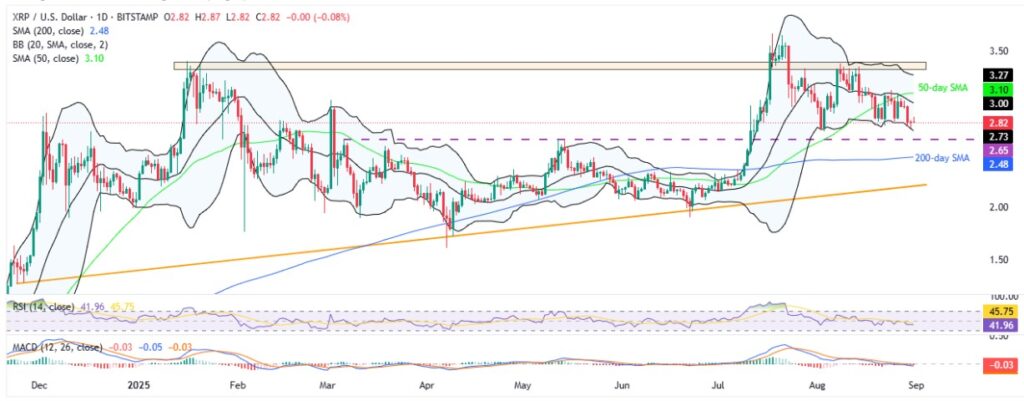
With the quote’s latest rebound from the lower BB, the XRP is likely to approach the middle BB line surrounding $3.00. However, the 50-day Simple Moving Average (SMA) could challenge the XRP buyers around $3.10.
Even if the bulls manage to cross the $3.10 hurdle, the upper BB and the aforementioned horizontal resistance area, respectively near $3.27 and $3.33-$3.36, will be tough nuts to crack for them before targeting the latest ATH of $3.67 and the $4.00 psychological magnet.
On the contrary, a downside break of the lower BB of $2.73 could drag the XRP to the previous resistance line from March, close to $2.65.
Below that, the 200-day SMA and an upward-sloping trend line from November 2024, near $2.48 and $2.20 in that order, will act as the final line of defense for the buyers.
Overall, the XRP’s corrective bounce appears overdue, but the reversal of the monthly loss seems too early to confirm.
Conclusion
The crypto space wrapped up the week on a softer note, weighed down by macroeconomic uncertainty and a round of profit-taking. But beneath the surface, there are signs of life, increased whale accumulation and rising on-chain activity, particularly around Ethereum and Ripple, suggesting something might be brewing.
With indecision about the Fed’s rate cuts past September, geopolitical tensions, and tech-sector nerves rattling sentiment, traders are now setting their sights on next week’s ISM Services PMI, U.S. labor market data, and any new messaging from the Fed.
Volatility is far from over, and hence, traders need to stay alert, as these catalysts could shape the next major move.
Also read: Binance Futures Trading Glitch Exposes Operational Inefficiencies


