
Weekly Summary
- Cryptocurrency weekly trends were consolidative, following an initial period of optimism, as weak U.S. data fuels hopes for Fed rate cuts.
- Bitcoin and Ripple’s XRP both snapped a three-week downtrend, but Ethereum posted its second consecutive weekly loss.
- U.S. employment report and Fed’s Beige Book bolster FOMC rate cut bets, overshadowing upbeat PMI data.
- Reinstatement of FTC head adds to Trump’s legal troubles, amid clashes with Lisa Cook and challenges to tariffs.
- Russian President Vladimir Putin showed openness to discuss a peace deal with Ukraine, but sets tough conditions.
- WLFI, stablecoin rush, and ECB’s Lagarde grabbed crypto traders’ attention amid mostly positive industry news.
- On-chain data suggests a rebound in top cryptocurrencies, especially ETH, as US/China inflation is eyed ahead of the September 17 FOMC meeting.
Cryptocurrency markets consolidated late August losses the last week, amid modest volatility, as U.S. statistics favored the Federal Reserve’s (Fed) rate cuts. Also entertaining the momentum traders were grim geopolitical and trade news, contrary to the industry-positive headlines for crypto.
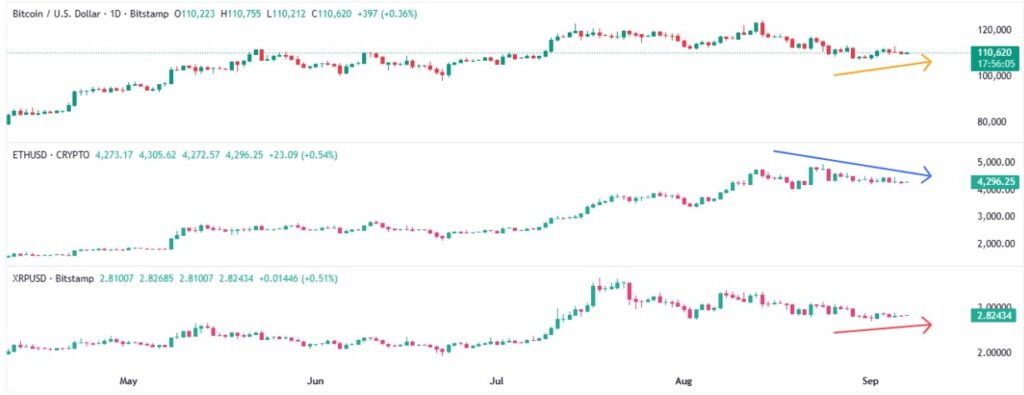
With this, Bitcoin (BTC) and Ripple (XRP), reported the first weekly gains in four, but Ethereum (ETH) dropped for the second consecutive week amid mixed on-chain and institutional demand signals.
Bitcoin Pares Losses: Bitcoin (BTC) dropped during three of the last seven days, but the early-week run-up offered 2.0% gains for the week. This marks the BTC’s first weekly gain in four, posting mild gains around the mid-$110,000s by press time. Notably, BTC’s losses in August were the first in five, but the pullback quickly reversed as the September Fed rate cut hopes escalated.
Ethereum Prints Two-Week Losing Streak: Ethereum (ETH) gained more attention as it reported the second weekly loss, extending the prior pullback from the all-time high (ATH), even as BTC and XRP recovered. That said, the ETH dropped around 2.0% over a week to $4,300 at the latest. Still, a slew of catalysts suggest potential for recovery in the second-largest cryptocurrency.
Ripple Rebounds: Ripple (XRP) dropped for four days in the last week, but snapped a three-week downtrend while reporting around 1.80% weekly gains, following the first monthly loss in three. In doing so, the XRP not only traces the BTC but also benefits from slightly upbeat on-chain metrics.
The Weekly Moves
Key Macro Catalysts
Global financial markets faced a relatively calmer week as the U.S. data bolstered odds of witnessing a Federal Reserve (Fed) interest rate cut in September, taming the late August doubts. The improved outlook lifted market sentiment, along with positive news and strong earnings from Wall Street.
Still, optimism was challenged by a series of political and legal developments involving former United States President Donald Trump. Also weighing on the risk sentiment were comments from Russian President Vladimir Putin, who showed readiness to discuss the Ukraine peace deal on his own terms.
Starting with the data, U.S. economic data came in mostly softer and bolstered the case for the Fed’s September rate hike concerns, but with inflation still sticky, the Federal Reserve’s move past September remains uncertain. This highlights the upcoming U.S. Consumer Price Index (CPI) and Producer Price Index (PPI) as crucial for determining market moves ahead of the September 17 meeting of the Federal Open Market Committee (FOMC).
U.S. employment report for August flashed another set of disappointing outcomes, following July’s weak print. That said, the headline Nonfarm Payrolls (NFP) eased, while the Unemployment Rate rose, and the Average Hourly Earnings, also known as the wage growth, appeared mostly stable.
However, the ISM Services PMI for August rose, and July Factory Orders improved, but final readings of the S&P Global Composite PMI for August softened compared to the initial estimations.
On the same line, the Fed’s Beige Book cited “little or no change” in the economic activity across most of the country in recent weeks.
Talking about the Fed commentary, Atlanta Fed chief Raphael Bostic, St Louis Fed President Alberto Musalem, and Fed Governor Christopher Waller all leaned towards September rate cuts while also defending the U.S. central bank’s independence. Meanwhile, Chicago Federal Reserve President Austan Goolsbee struck a cautious tone, saying the upcoming September meeting of the Federal Open Market Committee (FOMC) is “live” and that he has not yet decided on a rate cut.
With this, the CME Group’s FedWatch Tool shows an 89% probability of witnessing a 0.25% Fed rate cut in September, versus an 86.4% chance showed a week before. The prominent rate tracker also reflects strong market expectations for three consecutive rate cuts by the U.S. central bank across the remaining three monetary policy meetings of 2025.
U.S. President Donald Trump announced plans to impose tariffs on foreign semiconductor manufacturers. Further, the Wall Street Journal (WSJ) reported that US President Trump’s team eyes to reopen negotiations on the United States–Mexico–Canada Agreement (USMCA). On a positive side, Trump signed an executive order reducing tariffs on Japanese autos from 27.5% to 15%.
Elsewhere, legal tensions resurfaced as the D.C. Circuit Court of Appeals reinstated Rebecca Slaughter to the Federal Trade Commission (FTC) after her removal by Trump without cause. This raised doubts over Trump’s authority to dismiss federal officials, including Federal Reserve Chair Jerome Powell, and added friction amid his legal clash with Federal Reserve Governor Lisa Cook.
U.S. President Donald Trump accused Chinese President Xi Jinping of aligning with Russia and North Korea during a joint military parade, calling it a conspiracy against the United States.
Meanwhile, Russian President Vladimir Putin finally addressed the Russia-Ukraine peace deal, after a long wait, but showed a harsh stance and challenged the hopes of witnessing any agreement. Putin stated that there are legal obstacles within Ukraine regarding territorial agreements. The Russian leader also confirmed the start of dialogue with former U.S. President Donald Trump, rejected security guarantees for Ukraine from the European Union (EU) and the West, and expressed readiness to hold a summit, only if it is held in Moscow and Ukraine drops its plans to join the North Atlantic Treaty Organization (NATO).
Talking about Wall Street, investor confidence grew amid Fed rate cut hopes, news surrounding Broadcom and upbeat quarterly earnings.
The Financial Times (FT) news mentioned that OpenAI is working with Broadcom Inc. to develop custom artificial intelligence chips, expected to be out by 2026. Further, strong earnings reports from Broadcom, Copart, and Lululemon also favored the cautious optimism.
With this, S&P 500 refreshed record high and ended the week on a positive note, while Nasdaq snapped a two-week downtrend, but Dow Jones for the second consecutive week.
Looking forward, the market players may witness mixed performance ahead of Wednesday’s China CPI and U.S. PPI, as well as Thursday’s U.S. CPI and Friday’s preliminary readings of the University of Michigan (UoM) Consumer Sentiment and Inflation Expectations for September. Still, geopolitical and trade updates may keep traders active, mostly optimistic amid the dovish Fed concerns.
Crypto Market News
In the crypto universe, weakness in Ethereum (ETH) and pullbacks in Cronos (CRO) and Pyth Network (PYTH) gained major attention, along with growing doubts over further upside in Solana (SOL). Still, Bitcoin (BTC) and Ripple (XRP) managed to snap a three-week downtrend, whereas the Bitcoin Dominance rose.
European Central Bank (ECB) President Christine Lagarde raised concerns to tighten crypto security, while ECB Executive Board member Piero Cipollone promoted the ideal of a Digital Euro before the Economic and Monetary Affairs Committee. Still, several members of the committee questioned the real-world demand for a digital euro and raised concerns about how it might impact privacy and digital inclusion.
Also read: After Stablecoin Concerns, ECB Reviews the Digital Euro: What Lies Ahead?
Meanwhile, the on-chain analytics firm Coinglass unveiled forced position liquidations worth nearly $358 million in crypto assets following the downbeat U.S. employment report for August on Friday.
Also read: Crypto Liquidations Wipe $360 Million after U.S. NFP Data
Japan Post Bank announced plans to launch a digital yen by the end of fiscal 2026, offering easier access to digital transactions. The bank, managing around ¥190 trillion ($1.29 trillion) in deposits and partly owned by the Japanese government, will introduce DCJPY, a blockchain-based currency developed by DeCurret DCP.
On the same line, rumors surrounding Bank of China’s application for a stablecoin license fuelled the Chinese bank’s stock in the Hong Kong markets.
Notably, the Trump family-linked World Liberty Financial (WLFI) token witnessed a steep selling pressure on the first day of the 24.67 billion supply launch. Following the sell-off, the WLFI proposed using liquidity fees for the 100% buyback and burn of the tokens.
More here: Trump-Linked WLFI Goes Live With 24.67B Supply, Faces Instant Sell-Off
The speculations about World Liberty Financial’s (WLFI) economic strength escalated after Justin Sun denied a 50 million WLFI token sell-off, but the WLFI price kept falling.
Also read: Why WLFI Token Fell 50%? Justin Sun’s move Sparks Speculation!
The Nasdaq-listed Webus International Limited (WETO) formed a strategic alliance with Air China to avail crypto payment solutions to over 60 million PhoenixMiles loyalty program members. The joint efforts will bring Ripple’s XRP and RLUSD Stablecoin into Webus’ Wetour Travel platform with the objective of creating faster settlements and tokenized rewards on travel services.
Also read: Air China Partners with Webus to Pioneer XRP Payment Solutions for 60M Travelers
On a negative note, U.S. President Donald Trump’s sons Eric Trump and Donald Trump Jr. backed American Bitcoin (ABTC) faced a disappointing Nasdaq debut, following its merger with Gryphon Digital Mining. The firm’s shares dropped 95% on the first day of trading, listed at $184 and reached an initial high of $200 before falling to $8.04.
Also Read: American Bitcoin Stock Plunges 95% Post Nasdaq Debut
Elsewhere, news surrounding Etherealise, an Ethereum advocacy group, raising $40 million to introduce Wall Street to its blockchain vision and Ripple’s plan to expand to Africa also gained the market’s attention.
The Ethereum Foundation’s planned Holesky Testnet shutdown gained major attention. That said, technical challenges and a successful launch of the Hoodi testnet were cited as the key catalysts for ending Ethereum’s largest public testnet.
Read details here: Ethereum Announces Planned Holesky Testnet Shutdown
Notably, Tether mints the largest amount of USDT since December during the week, citing “inventory replenishment requests for cross-chain swaps” as the cause. The $2 billion USDT mind was similar to the December 2024 action by Tether, following which Bitcoin rallied 8% in 11 days, raising speculations of such strong moves as the BTC pokes key resistance of late.
Read more: Tether Mints $2B USDT amid Market Slump, Largest Since December
India tops Chainalysis’ Global Crypto Adoption Index for the third straight year, driven by rising digital payments, growing retail interest, and strong peer-to-peer trading.
Galaxy Digital plans to convert its shares into on-chain tokens. Details mention that Galaxy will use Superstate’s Opening Bell technology to convert its U.S. Securities and Exchange Commission (SEC) registered GLXY shares into the on-chain tokens. The KYC-approved shareholders can tokenize their shares, aiming for future trading on Decentralized Finance (DeFi) and Automated Market Maker (AMM) platforms, starting with Solana.
Bitcoin, Equities, and Gold Back In Sync
Bitcoin (BTC) notched its first weekly gain in four, up 2.0%, around $110,500 at the latest. The recovery reflects growing optimism around a dovish Federal Reserve move in September, positive on-chain trends, and a sustained institutional interest, bringing the BTC back in rhythm with equities and gold.
That said, the spot Gold (XAU) posted the biggest weekly jump since mid-May, up for the third consecutive week, and refreshing its all-time high, as market players rushed toward the traditional haven amid uncertainty surrounding the Fed, politics, and trade.
On the other hand, S&P 500 refreshed record high and ended the week on a positive note, while Nasdaq snapped a two-week downtrend, but Dow Jones for the second consecutive week.
Let’s start discussing the key BTC moves and data to understand the crypto major’s action.
Starting with the correlation chart from TradingView, Bitcoin (BTC) reported the first weekly gain in four, while the spot Gold (XAU) refreshed its ATH during a three-week uptrend, and the U.S. equity benchmark S&P 500 reported a modest week-on-week (WoW) gain, all portraying a synergy in the investment pattern.
With this, the BTC traders should stay optimistic as the latest data and news answer many questions. Still, uncertainties around the Fed interest rate decisions after September, concerns over the Fed’s independence, the ongoing Ukraine-Russia war, coupled with the impact of former President Donald Trump’s tariffs, could cloud the market outlook.
The S&P 500 approached its ATH on Friday, even as it dropped for three days in the week, reporting 0.30% weekly gain to 6,481 at the latest.
Gold (XAU/USD) grabbed the buyer’s attention, as it refreshed the record top near $3,600, up for the third consecutive week, as well as reported the biggest weekly gains since mid-May, all while ending the week’s trading around $3,585.
BTC, S&P 500 and Gold
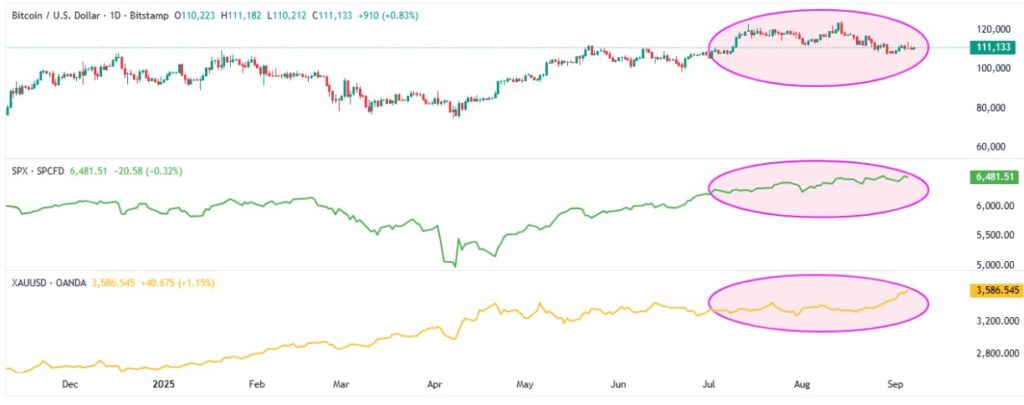
Notably, Bitcoin (BTC) parted ways from equities and gold in the last few weeks, before recently reconnecting with them. Historically, whenever such a pattern occurred, Bitcoin follows the stock market performance afterward, justifying the recent BTC rebound and signalling further price gains.
ETF Signals, On-Chain Developments Favor BTC Buyers
Starting with the latest U.S. spot Exchange Traded Fund (ETF) data from the SoSoValue, the Bitcoin (BTC) spot ETFs reported a two-day outflow pattern, with a daily outflow of $160.18 million on Friday.
Still, the weekly ETF performance marked a consecutive second inflow, worth $246.42 million for the last week.
It’s worth observing that August reported the first monthly outflow in five months, the biggest since March.
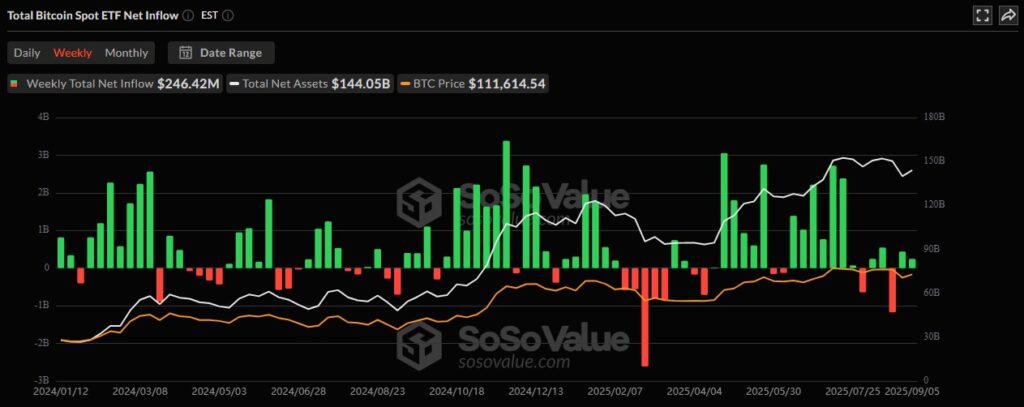
With this magnitude of surprise from the ETF flows on a monthly basis, the first monthly BTC loss in five was justifiable. However, this doesn’t signal the start of a bearish Bitcoin trend unless the outflows continue in the coming sessions.
Bitcoin Whales, MVRV Ratio & Network Details Eyed
Apart from the U.S. spot BTC ETF data, performance of the key wallets, upbeat total funding rates, and the Market Value to Realized Value (MVRV) metric portray promising signs for the the Bitcoin buyers. On the same line, the Network Realized Profit/Loss metric also underpins bullish bias surrounding the crypto major.
Bitcoin (BTC) MVRV Data, Total Funding Rates
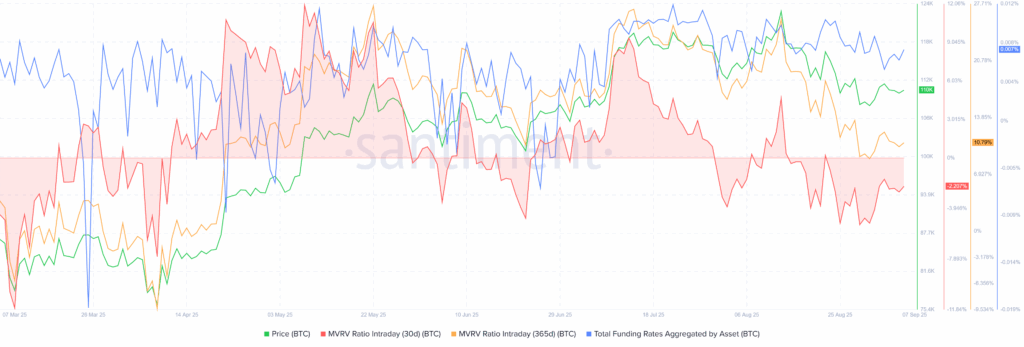
A combined metric showing Bitcoin’s Market Value to Realized Value (MVRV) and Total Funding Rates shows a cautiously optimistic picture.
That said, the MVRV (Market Value to Realized Value) ratio, which compares the current price to the average cost basis of holders, also known as the holder profitability, remains less risky on a long-term basis (over 10.79% on a 365-day basis), while staying downbeat in the short-term (-2.70% on 30-day). This doesn’t exactly portray the overheated market conditions for BTC, even if slight caution is needed, considering the long-term MVRV.
On the other hand is the Total Funding Rates Aggregated by BTC, a recurring fee that long positions pay to short positions, or vice versa, at predetermined intervals (usually every 8 hours), per Santiment. With gradually falling funding rates, the metric suggests that traders are turning cautious due to the latest price decline. That said, the cost index dropped 9.0% during the September 01 to 07 period, currently around 0.006109%.
Bitcoin (BTC) Network Realized Profit/Loss, Supply on Exchanges
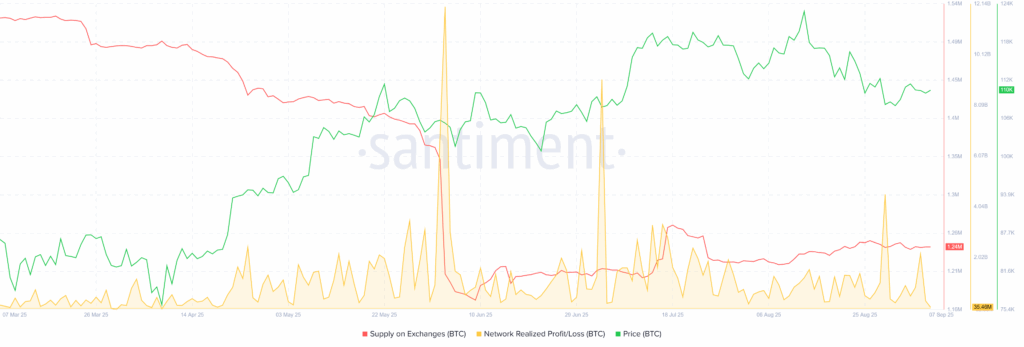
Apart from the BTC’s correlation with the S&P 500 Index and upbeat MVRV Ratio, a spike in the Network Realized Profit/Loss around the recent bottom also underpins hopes of an upcoming sturdy recovery in the crypto major’s price.
Network Realized Profit/Loss means the average profit or loss of all coins that change addresses daily, per Santiment. This also points to the previous weakness in the price, and a spike in the metric indicates healthy profit-taking, increasing the odds of witnessing a bullish BTC move amid sustained recovery in the market’s optimism.
Bitcoin Supply Distribution for September 01-07
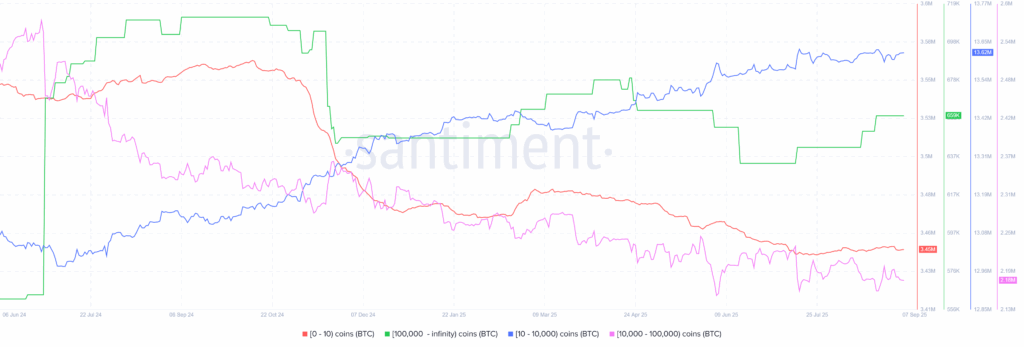
As per the Santiment data for the September 01-07 period, the wallets (addresses) holding 10–10,000 BTC, known as sharks, increased their holdings by 20,483 BTC, marking a 0.15% addition.
On the other hand, the retail wallets (holding 0–10 BTC) removed 1,994.00 BTC (or +0.06% liquidation), while the whales (wallets with 10,000–100,000 BTC) reduced their holdings by 15,957 BTC, or 0.73%, during the said period.
Meanwhile, the wallets with over 100,000 BTC holdings (mega-wallets) reported no change in their holdings during the stated period, currently around 659K BTC.
This suggest active participation in Bitcoin, even with large wallet holders (whales) cutting their positions while sharks increasing their exposure and retail traders are exiting. Such accumulation often signals a potential price recovery, hinting at a possible BTC upside ahead.
Technical Analysis Lures BTC Bulls
As per Bitcoin’s daily chart, momentum indicators like the Moving Average Convergence Divergence (MACD) and the 14-day Relative Strength Index (RSI) line portray a sustained support for the latest recovery in prices. Furthermore, the quote’s early-week recovery from an ascending support line from April, backed by the 14-day RSI line’s rebound from the oversold zone, also bolsters the recovery hopes.
Bitcoin Price: Daily Chart Suggests Short-Term Recovery
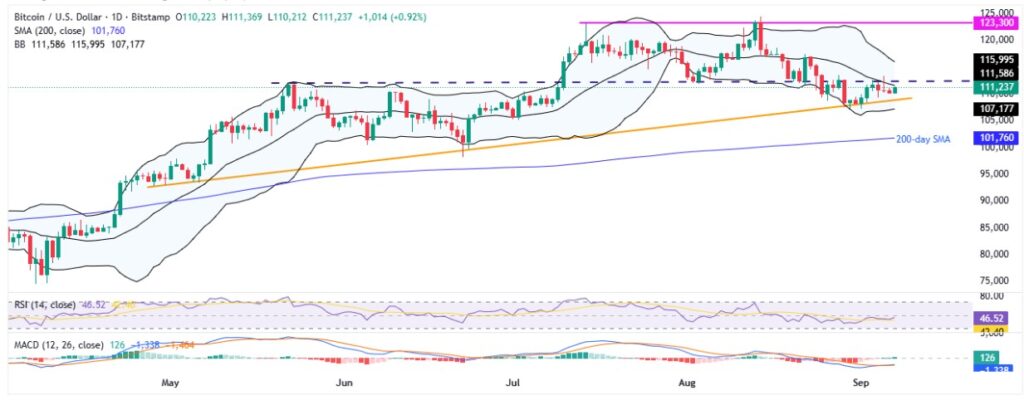
Despite BTC’s rebound from a four-month support line joins upbeat signals from the RSI and MACD momentum indicators to keep the buyers hopeful, they need a daily closing beyond a horizontal resistance comprising multiple tops marked since late May, close to $112,500.
Following that, the upper Bollinger Band (BB) around $116K and multiple levels marked since early July near the $117,500-$118,000 resistance region could lure the BTC bulls.
However, the BTC’s climb past $118K won’t be easy, but if achieved, bulls could target $120K and then a key resistance near $123,300. Breaking above $123,300 could pave the way to revisit the all-time high around $124,500 and possibly approach the $130K psychological level.
Alternatively, the aforementioned support line from late April, close to $109,000, appears to be a short-term key support to watch during the BTC’s fresh fall, before the lower BB support of $107,170.
Above all, the 200-day SMA near $101,760 becomes the final defense of the Bitcoin buyers, after which June’s low of $98,250 should grab the bear’s attention.
Ethereum Stays Weak!
Although Bitcoin and Ripple improved, Ethereum (ETH) dropped for the second consecutive week, bearing the burden of mixed on-chain signals, institutional demand, and position liquidations.
ETH ETFs Report Heavy Outflows
As per the latest SoSoValue data, the U.S. Ethereum (ETH) spot ETFs reversed the previous weekly inflow with a heavy daily and weekly outflow. That said, ETH ETF outflows were present for the fifth consecutive day on Friday, marking the record weekly outflow and justifying the ETH’s latest weakness in prices.
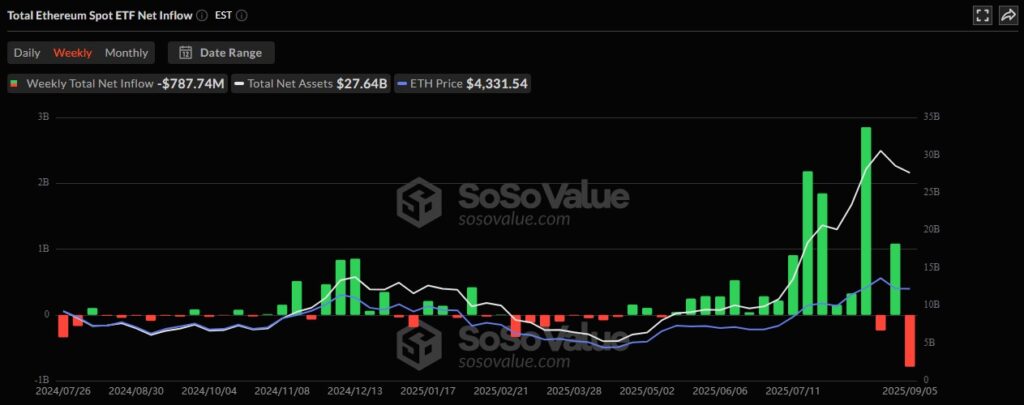
On September 05, the U.S. Spot ETH ETFs reported its fifth daily outflow, with a strong $446.71 million figure.
This also resulted in the record weekly ETH ETF outflows, with a total of $787.47 million for the week, following the surprising inflow in the previous week.
Meanwhile, August saw a fifth consecutive monthly inflow pattern, with the latest figures being $3.87 billion, versus July’s record inflows of $5.43 billion.
Ethereum On-Chain Data Flashes Mixed Signals
Even if the ETF outflows justify Ethereum’s latest fall, mixed signals from the on-chain metrics keep the ETH traders vulnerable.
Starting with the supply distribution data, the metic signals accumulation by the important wallets and suggest a recovery in price, but other on-chain signals are mixed and challenge the optimists.
Ethereum Supply Distribution for September 01-07
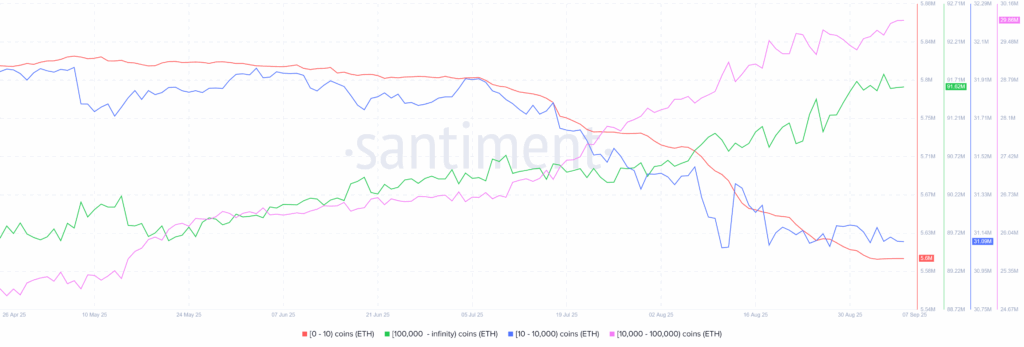
As per the Santiment data for September 01-07, the wallets (addresses) holding 10–10,000 ETH, known as sharks, cut their holdings by 49,103 ETH, marking almost a 0.16% reduction.
On the same line, the retail wallets (holding 0–10 ETH) also cut their holdings by 3,848 ETH (or -0.07%), while the whales (wallets with 10,000–100,000 ETH) increased their holdings by 327.86K, or +1.11%.
Meanwhile, the mega-wallets, wallets with over 100,000 ETH holdings, reported a slight increase in their holdings, by 41,180 or 0.04% during the stated period, currently around 91.57 million ETH.
Hence, mega wallets and whales have increased their ETH holdings, suggesting a strong confidence in the second-largest crypto.
Furthermore, the MVRV ratio still flashes warnings for the ETH bulls while the total funding rates are positive for them, but the Mean Dollar Invested Age (MDIA) remains weak. A fall in the MDIA suggests that long-dormant coins are re-entering the circulation channel via exchanges, a signal for heavy volatility for the coin. Additionally, Network Realized Profits/Loss Ratio is also upbeat, and the Supply on Exchanges continues to fall, suggesting a strong preference for holding the coin, another bullish sign.
Ethereum (ETH) MVRV Data, Total Funding Rates
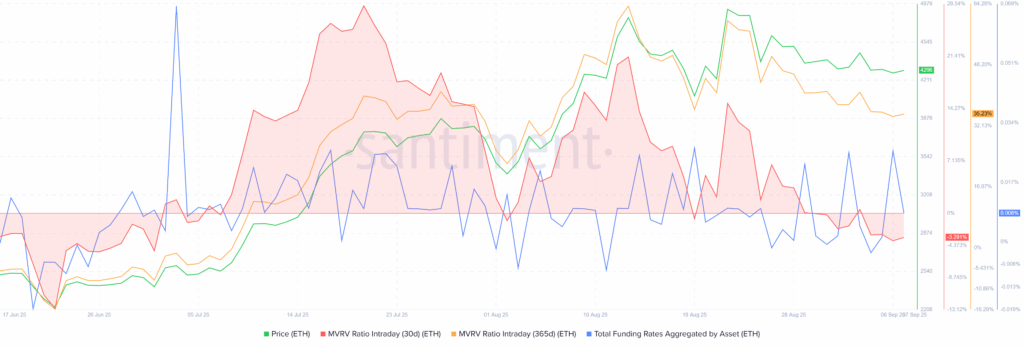
In case of Etehreum, MVRV metric appears more alarming, despite the latest fall, as long-term holders’ profitability remain too high (over 35% on 365-day MVRV), but the short-term holders (30-day MVRV) seem to be posting losses of around 3.29%. Hence, a pullback in the long-term profitability is still a concern for the ETH buyers.
It should be noted that the total funding rates grew 369% during the August 01 to 07 period, currently around 0.008233%. This shows the traders’ readiness to pay a higher premium to defend the position, long positions in this case, which in turn suggests increased bullish bias among the traders.
Ethereum (ETH) MDIA, Supply on Exchanges, Network Realized Profits
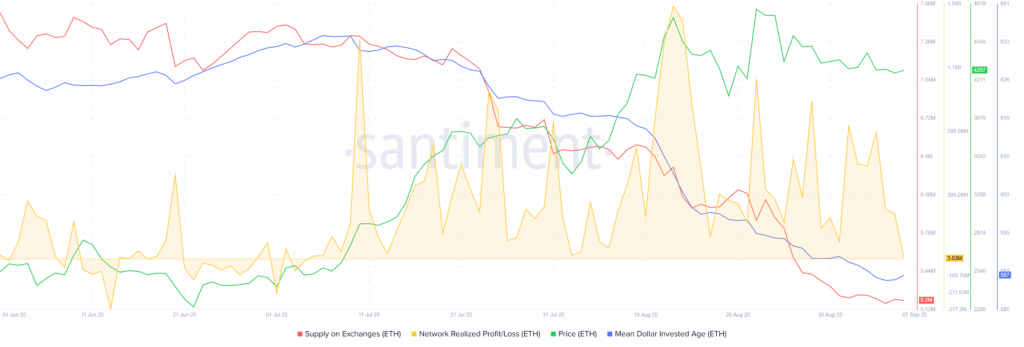
On a different page, Mean Dollar Invested Age, whichtracks the average age of invested capital, dropped over 7.5% since early July, near the lowest levels in five months surrounding 587 by the press time. On the same line, Supply on Exchanges slumped 30% to 5.20 million. However, Network Realized Profits marked a disappointment with a 98% loss during the stated period from early July to the August-end, currently around 283.13 million.
Meanwhile, Santiment cites a divergence in the social volume metrics to suggest waning retail speculation and an upcoming rise in the ETH price. The crypto data provider mentioned that discussion about Ethereum dropped by 31% compared to the previous week, signaling a sharp decline in crowd interest. The Santiment’s weekly report also mentions that a significant drop in crowd interest, like Ethereum’s, can sometimes precede a price rally.
These catalysts together suggests a healthy run-up in prices with a slight need for cautious as the Fed’s next move still depends on the data, even if the September rate cut and two more reductions are widely discussed.
ETH/BTC Chart Teases Ethereum Bears
While the on-chain signals are mixed and the ETF outflows poke optimism, the ETH/BTC ratio retreats from the key upside hurdle, namely the 100-week SMA. It’s worth noting, however, that the quote’s sustained breakout of a 23-month resistance line keeps the buyers hopeful.
ETH/BTC Ratio: Weekly Chart
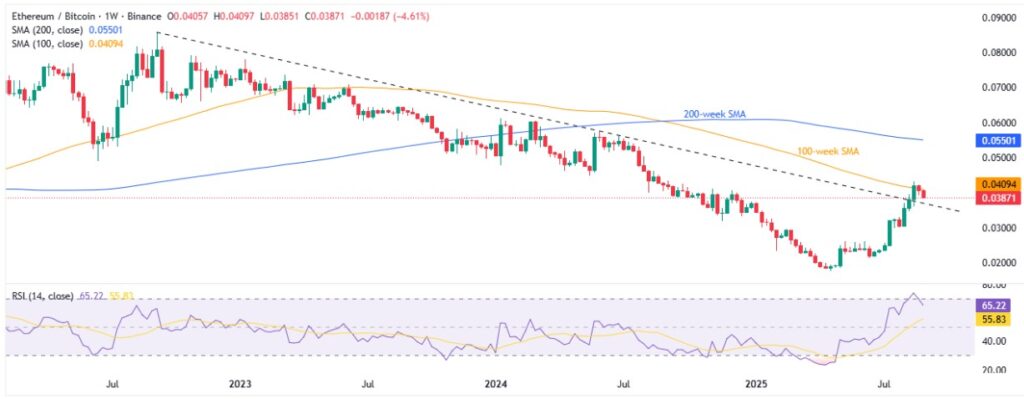
ETH/BTC ratio needs successful trading beyond the 100-week SMA of 0.04095 to renew optimism surrounding Ethereum.
However, the 14-Week Relative Strength Index (RSI) eases from the overbought territory past the 70.00 threshold, suggesting a consolidation in prices.
This highlights the multi-month previous resistance line, close to $0.0370 at the latest, as the decisive level, a downside break of which could trigger the much-awaited pullback in the prices.
Alternatively, an upside clearance of the 0.04095 hurdle comprising the 100-week SMA will open the door for the ETH/BTC ratio’s rally toward the 200-week SMA hurdle of 0.05500 before the yearly high of 0.06117.
Ethereum Technical Analysis Signals Consolidation
Ethereum’s technical analysis suggests a clear downside break of a two-month-old ascending support line, now resistance, amid bearish MACD signals, which in turn suggests a short-term weakness in the price momentum. However, the Bollinger Band, 50-day SMA, and sluggish signals from the Directional Movement Index (DMI) momentum indicator challenge downside hopes surrounding the ETH price.
Ethereum Price: Daily Chart Points To Short-term Pullback
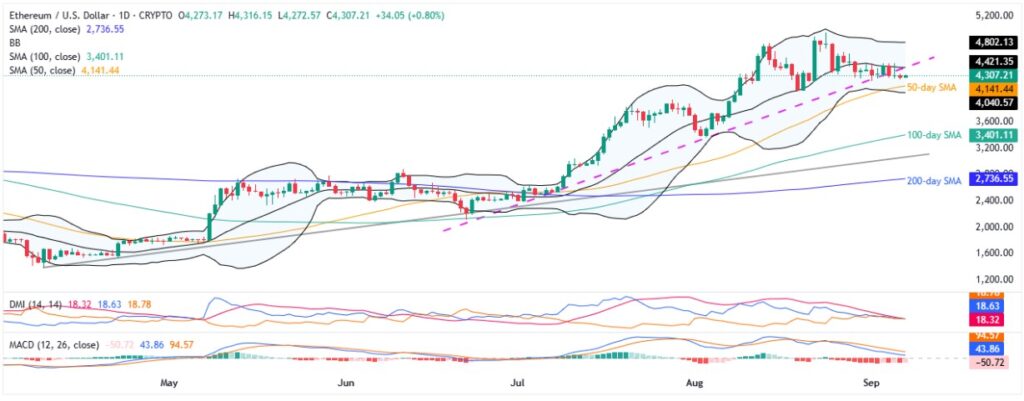
Ethereum’s clear break of a two-month support line joins bearish MACD signals to defend a short-term downside bias targeting the 50-day SMA support of $4,141.
However, the DMI’s Average Directional Index (ADX in Blue), the Upmove (D+ in Red), and the Downmove (D- in Orange) lines all sit around a weak 18 mark, well beneath the neutral 25 level, indicating slow momentum in the ETH market.
This could join the key SMA support to stall the ETH’s further downside; if not, then the lower BB support of around $4,040 can act as the final defense of the buyers.
Below that, the 100-day SMA level of $3,401 and a rising trend line from early April near $3,040 could lure the ETH sellers.
Above all, the 200-day SMA level of $2,736 appears to be the trend-changer for the ETH.
Alternatively, a convergence of the support-turned-resistance line joins the middle BB to restrict short-term ETH upside near $4,421.
After that, the August 17 swing high of $4,577 and the early-month peak of $4,782, as well as the all-time high (ATH) of $4,954 and the $5,000 psychological magnet, will gain the market’s attention.
Overall, the ETH’s latest pullback in price is likely to prevail but may not challenge the broader bullish outlook.
Ripple Traces Bitcoin
Ripple (XRP) posted its first weekly gain in three, by rising around 2.0% over a week to $2.82 by the press time, tracing Bitcoin’s rebound.
The XRP’s latest pullback could be linked to a recovery in the long-term and short-term profitability, as per the MVRV (Market Value to Realized Value) ratio. However, the whale buying has been almost absent and suggests a likely continuation of the pullback in prices, whereas the funding rates improved surprisingly, signaling a slight optimism among the buyers.
The MVRV (Market Value to Realized Value) ratio from Santiment, which compares the current price to the average cost basis of holders, spiked to risky levels when the XRP hit a record high, resulting in the following pullback and then a corrective bounce of late.
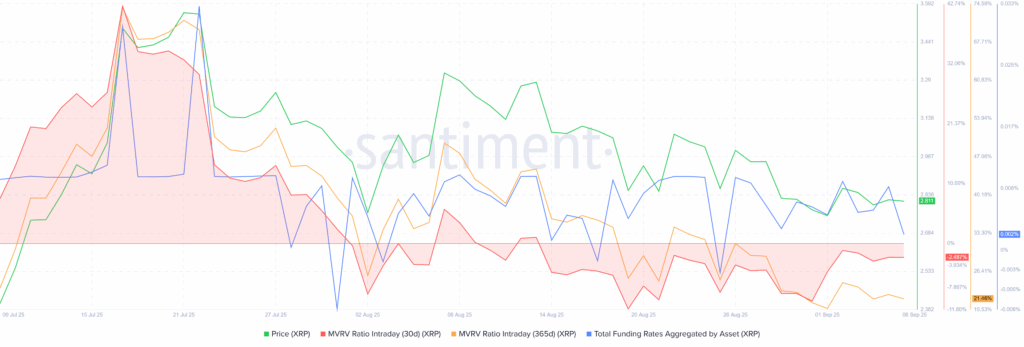
At its top, the XRP’s 365-day MVRV surged above +70% in July before retreating to 22% at the latest, showing most holders are in profit despite the retreat. It should be noted that the 30-day MVRV turned negative before improving in the last week from -5.05% to -1.67% at the latest, which in turn suggests a potential pullback for the short-term.
Further, the total funding rates grew from -0.005877% on August 31 to 0.007419% at the latest. This shows the traders’ fresh readiness to pay a higher premium to defend the position, long positions in this case, which in turn suggests fresh optimism among the traders.
Elsewhere, wallets holding 1 million or more XRP, known as whales, hit a record high of 2,749 earlier in July, close to 2,685 by the end of August 07, with these wallets collectively holding roughly $47.69 billion in XRP, up a bit from $47.43 billion marked on August 31. With this, Ripple buyers show slightly upbeat confidence, maybe because of the resolution of its multi-year battle with the U.S. Securities and Exchange Commission (SEC) and the recent adoption by AirChina and WeBus.
XRP 1M+ Coin Balance By Number & Total Balance Held
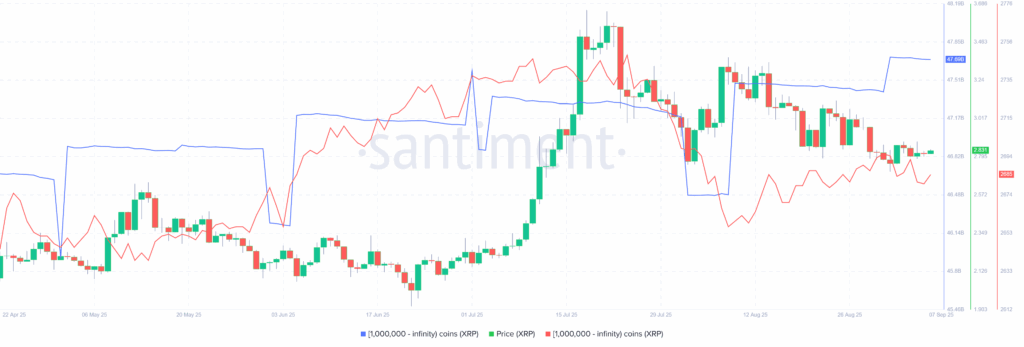
To sum up, the XRP’s MVRV Ratio and wallet performance favor the latest corrective bounce in the price. Overall, the three-week cooling off appeared a healthy correction after overheated gains. Still, without strong bullish fundamentals, which seem unlikely for now, the sluggish trend may continue.
Ripple Technical Analysis Suggests Short-Term Consolidation
From a technical standpoint, XRP seesaws between the 50-day and 100-day Exponential Moving Average (EMA). The consolidation joined a gradual recovery in the Stochastic indicator from the oversold territory to suggest a short-term bullish outlook.
Ripple Price: Daily Chart Signals Short-term Rebound
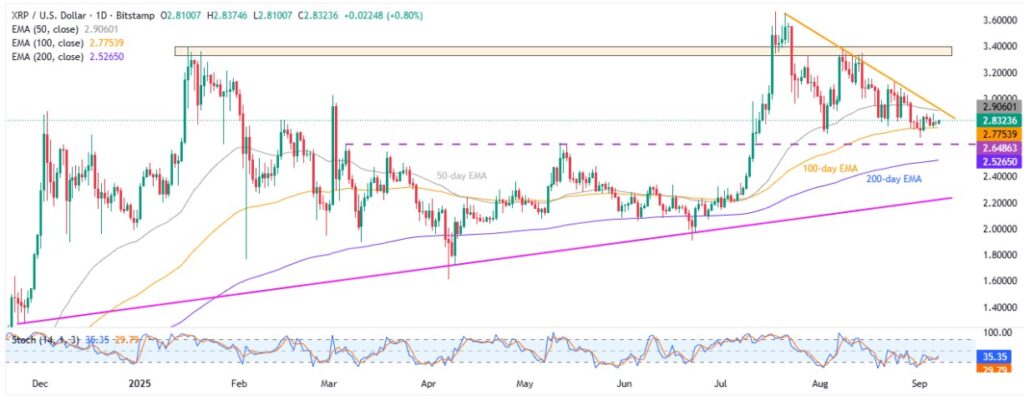
With the quote’s latest rebound from the 100-day EMA, backed by upbeat Stochastic momentum indicator, the XRP is likely to approach the 50-day EMA hurdle of $2.90.
However, a downward-sloping resistance line from late July, close to $2.95, as well as the $3.00 threshold, will be tough nuts to crack for the Ripple bulls.
Beyond that, the late August swing high around $3.10-$3.12 and a strong seven-month horizontal zone between $3.33 and $3.40 will be the last defense of the XRP bears, a break of which could open the door to challenge the record high near $3.67 and target the psychological $4.00 level.
On the contrary, a downside break of the 100-day EMA support of $2.77 could drag the XRP prices back to the previous resistance line from March, close to $2.65.
In a case where the bears manage to smash the $2.65 support, the 200-day EMA and an upward-sloping trend line from November 2024, near $2.52 and $2.22 in that order, will be the last hopes of the buyer’s return before giving control to the bears.
Overall, the XRP’s corrective bounce appears overdue, but the reversal of the previous monthly loss seems too early to confirm.
Conclusion
The crypto space wrapped up the week on a positive note, fuelled by Fed rate cut hopes. However, the macroeconomic uncertainty and geopolitical tensions prevail, along with mixed on-chain signals, which in turn require traders to remain cautious as they brace for inflation numbers from the world’s top two economies, namely the U.S. and China.
Notably, on-chain details of Ethereum are interesting, raising questions on its sustained weakness, but the ETF outflow and technical breakdown challenge the buyers.
Meanwhile, Bitcoin and Ripple are both more likely to defend the latest recovery, unless the scheduled data question the Fed’s rate cuts past September.
Above all, the volatility is likely to prevail, despite fewer economic details, but the cautious tone before the September 17 FOMC might challenge the latest optimism in the crypto markets.
Also read: Public Firms Now Hold 1M Bitcoin, 3.2M Ether, 2M Solana as Corporate Treasuries Grow Holdings


