Cryptocurrency Weekly Summary
- Cryptocurrency weekly action turned volatile as dovish Fed bets met trade war, geopolitical, and U.S. shutdown woes amid mixed market signals.
- Bitcoin and Ripple snapped a two-week downtrend, but Ethereum struggles to recover.
- Ex-Binance Chief CZ’s Presidential pardon and softer-than-expected U.S. CPI helped buyers recover losses despite a strong Dollar.
- U.S.-China trade tensions, Western sanctions on Russia, BTC whale selling, and U.S. spot ETH ETF outflows challenged crypto optimism.
- U.S. equities rallied to refresh record tops, and Gold posted the first weekly loss in 10.
- October Federal Reserve monetary policy meeting, Q3 earnings from Wall Street giants, and risk news will offer another busy week.
Cryptocurrency Weekly Snapshot
Cryptocurrency traders witnessed a volatile week, despite the ongoing U.S. government shutdown, as a mixed bag of news joined the U.S. Consumer Price Index (CPI) data to fuel momentum.
A U.S. Presidential pardon for Binance founder and former CEO Changpeng “CZ” Zhao, along with a much-awaited pullback in gold prices and softer U.S. CPI data, helped underpin crypto market optimism.
On the other hand, the firmer U.S. Dollar, growing anxiety about the U.S.-China trade war, Western sanctions on Russia, BTC whale selling, and a sustained outflow of U.S. spot ETH from the Exchange-Traded Fund (ETF) tamed crypto market optimists.
Amid these plays, Bitcoin (BTC), Ripple (XRP), Binance Coin (BNB), Hyperliquid (HYPER), and Monetro (MONERO) posted weekly gains. However, Ethereum (ETH) remains under pressure, on the way to posting a third consecutive weekly loss.
Bitcoin Rebounds: Bitcoin (BTC) recorded its first weekly gain in three, by rising for five days in the last week, up 2.5% on the week to $111,700 by press time. Still, the BTC is down over 2.0% for the month.
Ethereum Remains Under Pressure: Ethereum (ETH) diverges from BTC while posting close to 1.0% weekly loss in its third week-over-week downtrend, to $3,950 at the latest. The ETH’s latest slump not only extends its previous weekly losses but also adds more losses to the monthly figure of -4.50%.
Ripple Rises: Ripple (XRP) leads top crypto coin gainers with its first weekly gain in three, up over 6.0% to $2.55 as we write. Even so, the XRP is down 10% for October.
The Weekly Moves
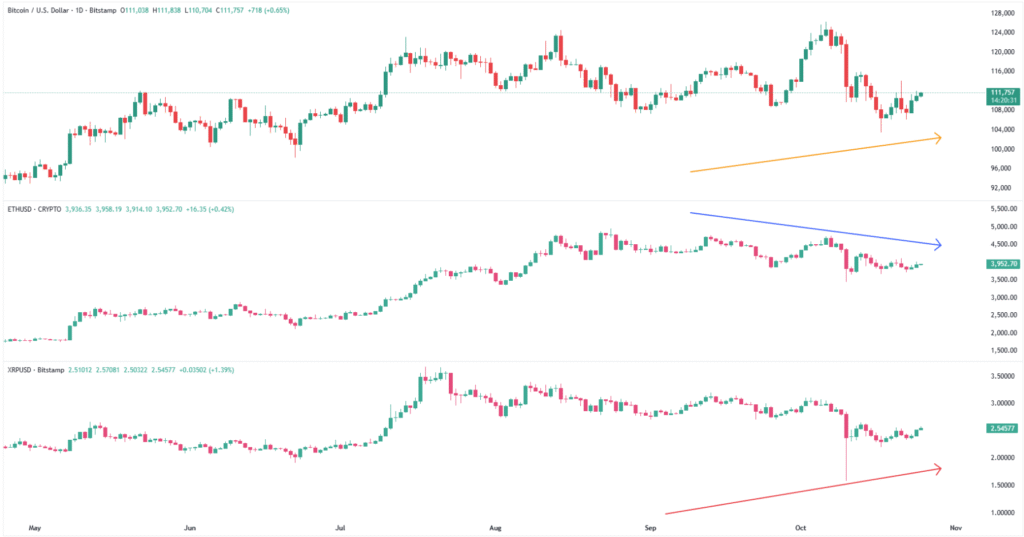
Key Macro Catalysts
While tracing the key catalysts, U.S. President Donald Trump’s pardon of Binance founder Changpeng ‘CZ’ Zhao gained major attention among the crypto enthusiasts, allowing Binance Coin (BNB) to pare the biggest weekly loss since July 2024.
Also positive for the markets were mostly upbeat third-quarter (Q3) earnings reports from Procter & Gamble, Intel, GE Aerospace, and Coca-Cola, despite downbeat Q3 results from Tesla and Netflix.
Elsewhere, the U.S. Bureau of Labor Statistics (BLS) released the Consumer Price Index (CPI) for September and bolstered the market’s expectations of witnessing further rate cuts from the U.S. Federal Reserve (Fed), helping the risk complex. That said, the headline CPI and the Core CPI both printed 3.0% Year-over-Year (YoY) figures, much higher than the Fed’s 2.0% target, but beneath the 3.1% market forecasts.
On the contrary, Trump’s 155% tariffs on China, and anxiety ahead of a potential meeting between U.S. President Trump and his Chinese counterpart, Xi Jinping, challenged the risk-on sentiment.
Meanwhile, the U.S. shutdown continues to hinder the data flow, as well as extend uncertainty surrounding the U.S. Securities and Exchange Commission’s (SEC) approval of the altcoin exchange-traded fund (ETF) approval, which in turn negatively affected the crypto performance.
Further, the Western sanctions on leading Russian oil companies escalated geopolitical tensions, even as the Kremlin still considered Trump as a ‘friend’.
For more macro updates like this, please check our news section here!
Crypto Market News
In the crypto universe, Bitcoin (BTC) and Ripple (XRP) witnessed notable recovery during the last week, even as Ethereum (ETH) reported its third consecutive weekly loss. The risk-on mood failed to tame the U.S. Dollar, while U.S. spot ETH ETF outflows weighed on Ethereum, even as BTC whale selling couldn’t challenge Bitcoin buyers.
That said, Bitcoin (BTC), Ripple (XRP), Binance Coin (BNB), Hyperliquid (HYPE), and Monetro (XMR) posted weekly gains. However, Ethereum (ETH) remains under pressure, on the way to posting a third consecutive weekly loss.
Meanwhile, the crypto market capitalization (market cap) rose over 3.0% to $3.76 trillion, whereas the Bitcoin Dominance also improved from 59.0% to 59.2%.
That said, some of the top crypto news are as follows, while more updates like this could be traced to our Coin Bytes.
Binance founder and former CEO Changpeng “CZ” Zhao grabbed the market’s attention on Thursday, mainly due to U.S. President Donald Trump’s pardon for charges concerning Binance’s Anti-Money Laundering failures.
Read Details: Busy Day for Binance’s CZ: Trump Pardon, Schiff Feud, and ReachMe Closure Put CZ Back in Focus
Australia tops most developed nations in terms of crypto adoption, from 28% of the total population in 2024 to 31% in 2025, according to a16z’s State of Crypto 2025 report.
For More: Australia Surpasses Most Developed Nations In Terms Of Crypto Adoption
Polymarket just opened the door for everyday users and professional traders to predict short-term crypto price moves in 15-minute intervals, backed by Chainlink’s trusted data feeds. The update allows traders to bet on whether a cryptocurrency’s price will go up or down within that window, combining the excitement of real-time trading with the transparency of blockchain.
Europol dismantled a Latvian crypto phishing ring that provided ‘services’ to international cybercriminals. The European law enforcement arrested seven suspects and seized millions in assets, including crypto, from a sophisticated crime-as-a-service operation behind 49 million fake accounts.
Read More: Europol Dismantles Major Latvian Crypto Phishing Ring in International Sting
Crypto exchange Gemini unveiled a specialized Gemini Solana Credit Card that provides rewards to users in SOL and includes staking as part of its rewards structure, offering more than 10% passive earnings to users.
For Details: Gemini Solana Credit Card Offers 4% Spending Rewards & 6.77% Staking Yield
Elsewhere, Chinese regulators, including the People’s Bank of China and the Cyberspace Administration, instructed major tech firms to suspend their stablecoin initiatives in Hong Kong. Beijing’s actions pushed Alibaba-backed Ant Group and JD.com to pause their plan for Hong Kong’s pilot stablecoin program.
Also read: Ant Group, JD.com Pause Stablecoin Projects as China Regulators Push Back
Position Liquidations
Crypto market position liquidation flashed mixed signals, with long liquidations questioning the latest rebound in the major coins. That said, position liquidation is the forced closing of a trader’s positions by a broker due to insufficient margin. This data reveals whether long (buy) or short (sell) positions were closed, helping explain recent price movements. Typically, heavy long liquidations happen during a downtrend and suggest short-term bearish sentiment, and vice versa.

During the October 19 to 25 period, a total of $2.486 billion of positions were liquidated, per the CoinGlass data. Out of which, “Long Positions” contributed $1.37 billion, whereas “Short Positions” accounted for $1.12 billion, suggesting a bigger flow of long liquidations.
Bitcoin Recovers, Equities Rise, But Gold Retreats
Bitcoin (BTC) notched the first weekly gain in three, ignoring whale selling and firmer U.S. Dollar amid risk-on mood. The upbeat sentiment also fueled the U.S. equity benchmark S&P 500 (SPX) for the second consecutive week, up 1.92% on the week, despite retreating from a fresh all-time high (ATH) of 6,807 to 6,791 on late Friday.
However, the spot Gold (XAU) snapped its nine-week uptrend, down 3.29% weekly to $4,114 by press time.
With this, the BTC resumes its historical linear relationship with equities, but not with Gold. Santiment’s weekly report cites this as an early bullish sign, as Bitcoin buyers could portray the Fear of Missing Out (FOMO) once the market’s risk profile improves.
To clearly visualize links among these key risk assets, let’s see the correlation chart from TradingView.
BTC, S&P 500, and Gold
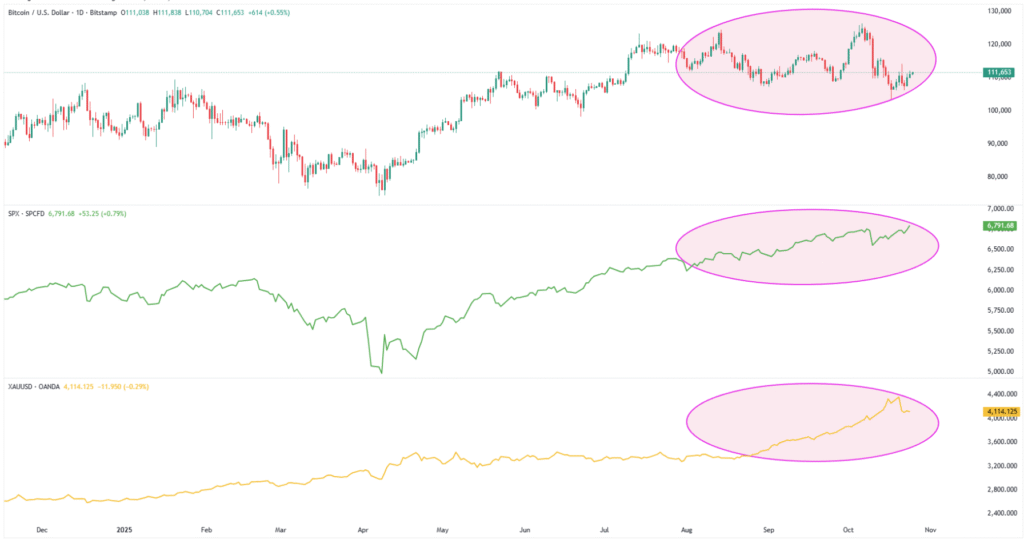
With the clearly linear relations between Bitcoin, Gold, and the U.S. equities on a broader timeframe, despite the latest friction, the BTC traders should be optimistic if the market remains positive, which is likely during the late October period.
BTC ETF, Whale Signals Flash Mixed Clues
Bitcoin’s (BTC) latest rebound takes clues from the ETF inflows, but the whale selling challenges buyers ahead of the key Federal Open Market Committee (FOMC) monetary policy meeting next week.
Starting with the latest U.S. spot Exchange Traded Fund (ETF) data from the SoSoValue, the Bitcoin (BTC) spot ETFs reported consecutive two-day inflows, with Friday’s daily inflow of $90.60 million.
Notably, BTC reported a two-week high daily ETF inflow on October 21, worth $477.19 million, which in turn allowed the crypto major to reverse the previous outflow pattern. With this, the spot BTC ETFs marked the weekly inflow of $446.36 billion for the last week.
It’s worth observing that August reported the first monthly outflow in five months, the biggest since March, but September’s inflows were stellar with the $3.53 billion figures, whereas the October inflows have been $4.22 billion by press time.
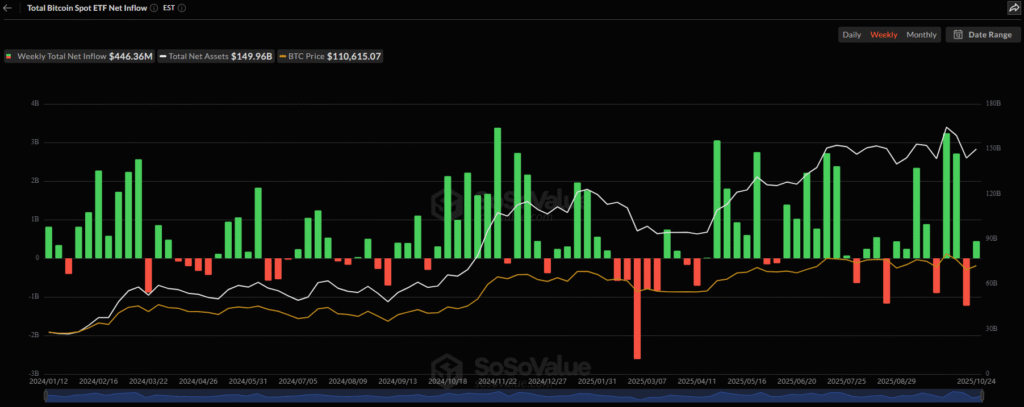
With this magnitude of surprise from the ETF flows on a weekly basis, the BTC bulls should remain optimistic going forward.
Alternatively, Whale Wallets, addresses holding between 10 and 10,000 BTC, flashed a negative signal, according to Santiment. “Bitcoin whales have sold approximately 18,863 BTC in the past 11 days,” said the crypto data platform.
Technical Analysis Backs BTC Rebound
Bitcoin’s early-week reversal from the 200-day Simple Moving Average (SMA) joins the impending bullish crossover on the Moving Average Convergence Divergence (MACD) momentum indicator to lure BTC buyers.
Adding strength to the recovery hopes is the Directional Moving Indicator’s (DMI’s) Upmove (D+, Blue) line, which crosses the Downmove (D-, Orange) line from below to take the top spot.
However, the Average Directional Index (ADX, red) line is still at the bottom, as well as below the 25.00 neutral mark, suggesting a weak momentum, highlighting the need for a strong fundamental catalyst to propel Bitcoin.
Bitcoin Price: Daily Chart Lures Bulls
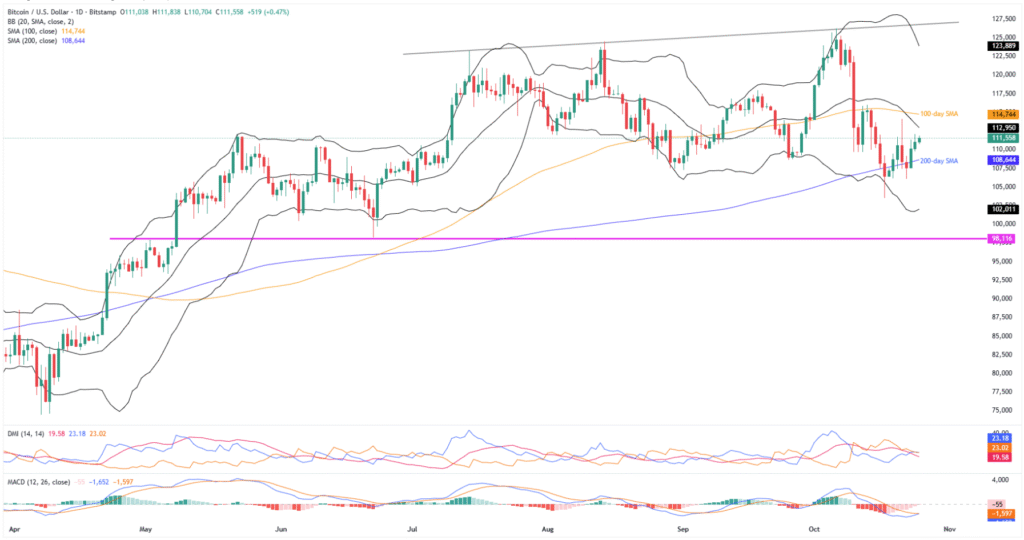
Bitcoin’s early October recovery from the lower Bollinger Band (BB), currently around $102K, paved the way for its U-turn from the 200-day SMA. The recovery momentum takes clues from the looming bullish MACD and DMI signs to lure buyers.
With this, the BTC stays on the way to confronting the middle BB hurdle of around $112,955, ahead of poking the 100-day SMA of $114,745.
Should Bitcoin buyers manage to keep the reins past the 100-day SMA on a daily closing basis, the quote’s successive rally toward September’s high, surrounding $118K, can’t be ruled out. However, the upper BB and an ascending trendline from mid-July, respectively near $123,900 and $126,900, will be tough nuts to crack for Bitcoin buyers.
Alternatively, the 200-day SMA support of $108,645 restricts short-term BTC downside before multiple levels near the $106K, the monthly low of $103,530, and the lower Bollinger Band near $102K.
More importantly, a 5.5-month-old horizontal support near $98,000 will be crucial for Bitcoin sellers to watch as a clear break beneath the same could challenge the crypto major’s broad bullish trend by initially highlighting $91,000, $88,000, and April’s low near $74,400 support levels.
Ethereum Stays Weak!
Even if the crypto market optimism allowed major coins to pare previous losses, Ethereum (ETH) remains on the back foot for the third consecutive week, down close to 1.0% weekly to $3,950 at the latest.
While tracing major catalysts, the consecutive second weekly U.S. spot ETH ETF outflow gains major attention.
ETH ETFs Report Second Weekly Outflow
As per the latest SoSoValue data, the U.S. Ethereum (ETH) spot ETFs reported their second weekly outflow, after hitting a seven-week high in late September.
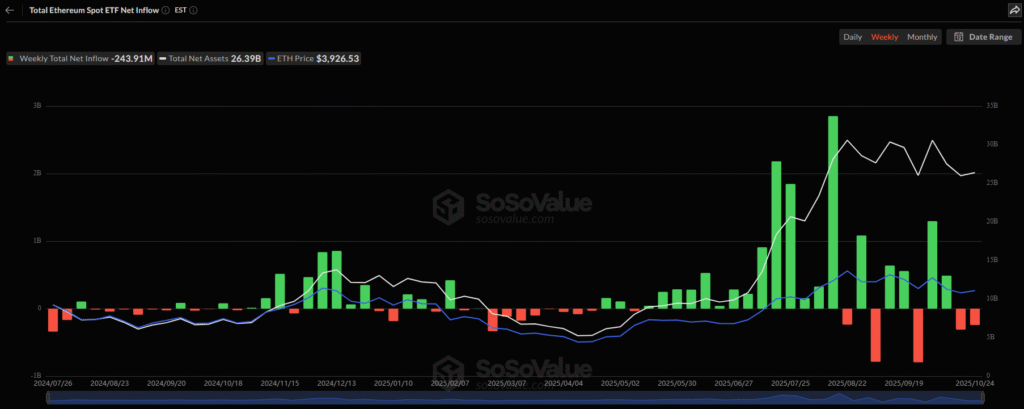
On October 24, the U.S. Spot ETH ETFs reported its second daily outflow, with a $93.60 million figure. Notably, the ETH ETFs posted outflows for four days in the last five.
This resulted in the second weekly ETH ETF outflows, with a total of $243.91 million for the week.
Still, the monthly ETH ETF scenario is upbeat as it reports the seven-month inflow pattern, with October’s inflows being $553.95 million by press time.
Ethereum Technical Analysis Teases Buyers
Ethereum’s sustained trading within a fortnight-old symmetrical triangle joins an impending bullish crossover on the MACD and a steady 14-day Relative Strength Index (RSI) line to lure short-term buyers. Apart from the stated triangle, the 50-day Exponential Moving Average (EMA) adds to the upside filters for the ETH, before welcoming the bulls.
Ethereum Price: Daily Chart Lures Bulls
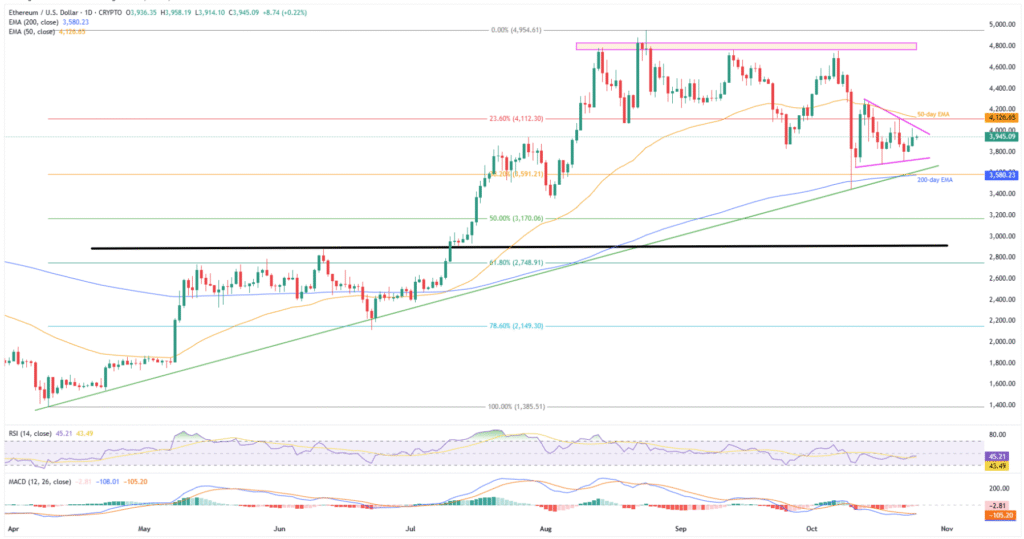
At present, the ETH buyers look well-set to approach the $4,030 resistance level, comprising the aforementioned triangle’s upper boundary. However, the quote’s further upside needs validation from the RSI and MACD momentum indicators.
Should Ethereum manage to portray a bullish breakout of the triangle, the 23.6% Fibonacci retracement of its April-August upside and the 50-day EMA, close to $4,115 and $4,130, will be crucial to watch.
In a case where the ETH remains firmer past $4,130, a horizontal area comprising multiple levels from mid-August, near $4,830-$4,768, will be crucial before buyers can aim for the fresh ATH, currently around $4,955. This highlights the $5,000 threshold for the ETH bulls.
On the flip side, the triangle’s support of $3,730 can lure Ethereum sellers during the altcoin’s fresh downside.
After that, an ascending support line from early April and the 200-day EMA, respectively near $3,620 and $3,580, hold the key to the quote’s further fall toward the 50% Fibonacci ratio and a four-month horizontal support, close to $3,170 and $2,900 in that order.
It’s worth mentioning that the ETH’s weakness past $2,900 will put the broad bullish trend at risk, while directing prices further south toward the 78.6% Fibonacci ratio and the yearly low, close to $2,150 and $1,385 in that order.
Ripple Justifies Ecosystem Optimism…
Ripple (XRP) outshines while posting the first weekly gains in three, up over 6.0% to $2.55 as we write. In doing so, the altcoin justifies optimism surrounding a jump in the first XRP ETF’s Asset Under Management (AUM), as well as possible approval of the crypto ETFs by the United States Securities and Exchange Commission (SEC) and multiple ecosystem positives.
That said, the REX-Osprey’s XRP ETF, namely the XRPR, crossed the $100 million AUM benchmark in less than a month after its launch in September.
Meanwhile, Ripple co-founder Chris Larsen liquidated 50 million XRP worth $120 million and raised eyebrows among the altcoin traders.
Read more Ripple news from here.
Ripple Technical Analysis Looks Bullish
The XRP’s clear rebound from an 11-month-old trendline support joins the bullish Stochastic momentum indicator to attract buyers’ attention. However, the quote’s sustained reversal from a multi-month horizontal resistance and the 200-day EMA, as well as the previous weekly slump beneath the 100-day EMA, highlight the need for a strong catalyst to confirm its bull run.
Ripple Price: Daily Chart Suggests Further Upside
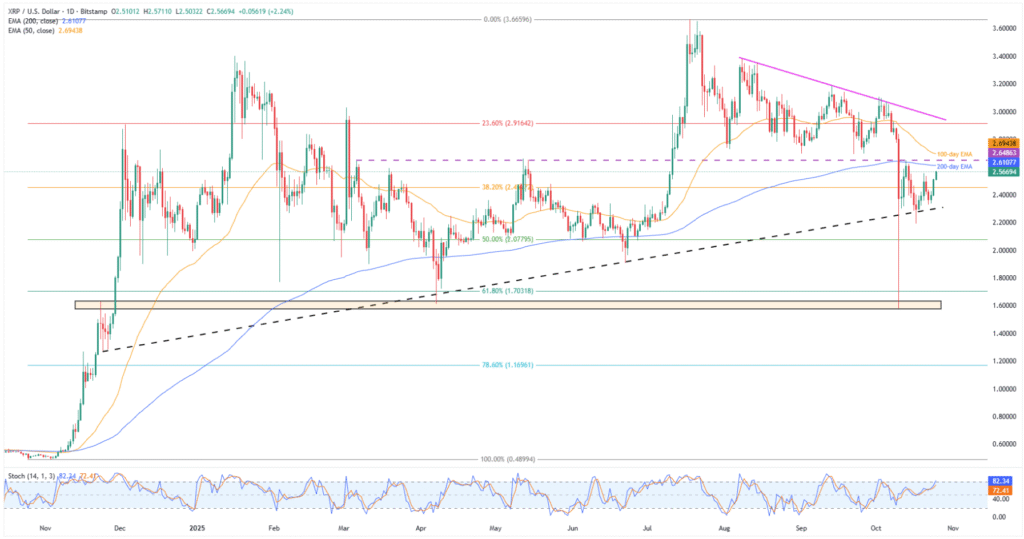
With a clear rebound from the multi-month support line, backed by bullish Stochastic, the XRP looks set to challenge the 200-day EMA hurdle of $2.61 and a horizontal resistance from March near $2.65.
Beyond that, the 100-day EMA hurdle of $2.69 and the 23.6% Fibonacci retracement of the October 2024 to July 2025 rally, near $2.92, will precede a downward-sloping resistance line from early August, close to $2.97 at the latest, to challenge the bulls before giving them control.
Conversely, an ascending trendline from November 2024, close to $2.29, the 50% Fibonacci ratio of $2.08, February’s low of $1.77, and the 61.8% Fibonacci ratio surrounding $1.70, might lure the bears during the XRP’s fresh fall.
However, a horizontal area comprising levels from November 2024, near $1.63-$1.58, appears to be a tough nut to crack for Ripple bears.
Following that, sellers can for a gradual south-run targeting the late 2024 bottom of $0.49, with the 78.6% Fibonacci retracement of $1.17 and the $1.00 likely acting as intermediate halts.
Conclusion
The crypto market’s latest optimism takes clues from the dovish Fed hopes ahead of next week’s FOMC, backed by a softer U.S. CPI data. Also keeping the risk assets firmer were headlines suggesting an earlier end to the U.S. government shutdown, a recovery in the ETF inflows, and positive industry news, as stated above.
Given the widely anticipated 0.25% rate cut from the U.S. central bank in its October FOMC, next Wednesday, the crypto buyers are likely to tighten the grip, provided the policymakers affirm further easy-money steps and the FOMC statement looks dovish.
Apart from the FOMC, the U.S. third quarter (Q3) Gross Domestic Product (GDP), the European Central Bank’s (ECB) monetary policy meeting, and the scheduled release of the Fed’s preferred inflation gauge, namely the Core Personal Consumption Expenditure (PCE) Price Index, for September, will also entertain the market players.
Should the potential optimism materialize, the XRP and the BTC may witness stronger recoveries than the ETH, as fears surrounding ETF outflows and technical patterns may weigh on Ethereum.
Also read: Top 5 Altcoins to Watch in October 2025


