
Cryptocurrency Weekly Summary
- Cryptocurrency weekly moves faced action as concerns at Jackson Hole triggered consolidation before buyers stepped in.
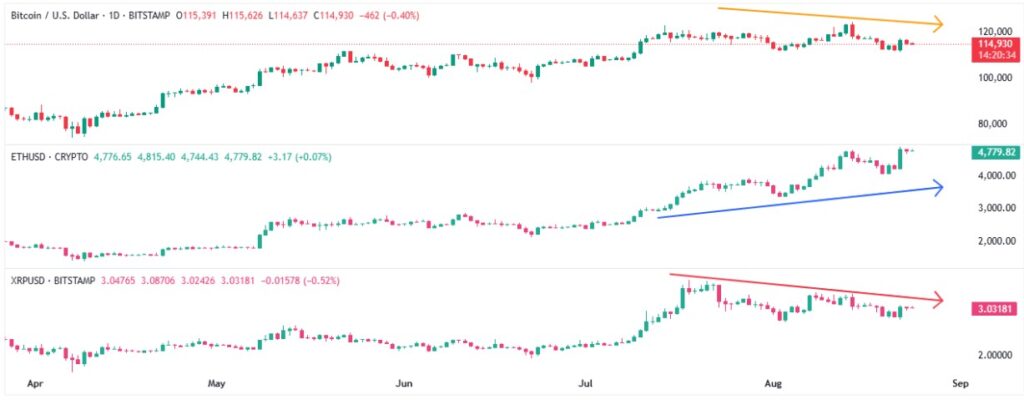
- Ethereum stole the limelight with a fresh all-time high, but BTC and XRP printed two-week losses despite Friday’s strong rebound.
- Stablecoin news gained attention, while pro-crypto firms turned cautious after the latest decline in crypto prices.
- The Fed’s September rate cut is given, but Powell’s data dependency keeps upcoming US inflation and growth figures crucial for guiding market moves.
Cryptocurrency Weekly Snapshot
Cryptocurrency markets experienced heavy volatility last week as early jitters over Fed Chair Powell shook major coins before sparking a sharp rebound. Ethereum (ETH) stole the show with a new all-time high, while Bitcoin (BTC) and Ripple (XRP) couldn’t shake early losses despite Friday’s bounce, marking their second straight week down.
Bitcoin Bears Kept The Reins: Bitcoin (BTC) surged with its biggest daily gain in six weeks on Friday after Fed Chair Powell’s Jackson Hole speech weakened the US Dollar and boosted risk assets like stocks and crypto. Still, BTC closed the week down 2.3%, continuing a two-week slide near $115K.
Ethereum Posts Record Top: Ethereum (ETH) gained more attention as it renewed the all-time high during Friday’s stellar run-up of over 14%. With this, the second-best cryptocurrency eyes its third consecutive weekly gain, reaching $4,780 at the latest.
Ripple Stays Pressured: Ripple (XRP) failed to impress buyers, despite the post-Powell rally. That said, the altcoin drops near 2.0% during the week, to around $3.03 as we write.
The Weekly Moves
Key Macro Catalysts
Volatility was all over the global financial markets as early-week U.S. data and events raised doubts about the Federal Reserve’s (Fed) rate cuts and weighed on risk assets. However, Friday’s Jackson Hole speech from Fed Chair Powell bolstered the sentiment while confirming the need for easy-money policy, and still defending his data-dependency approach. Apart from that, headlines surrounding a meeting between Ukrainian President Volodymyr Zelensky and Russian President Vladimir Putin also contributed to the market momentum.
Early in the last week, the Federal Open Market Committee (FOMC) Minutes, and preliminary August Purchasing Managers’ Index (PMI) data joined hawkish statements from mid-tier Fed officials to weigh on the sentiment. These concerns turned grim before Friday as some on the table also started doubting the widely chattered September rate cut, forget about two more rate cuts in 2025 discussed among the traders. This pushed the U.S. Dollar higher and weighed on the risk assets like equities, commodities and cryptocurrencies.
However, the market’s fears were swiftly reversed on Friday as Fed Chair Jerome Powell delivered a key speech at the annual Jackson Hole event of the global central bankers.
Powell defended his data-dependency approach but provided clear clues for the need for rate cuts while stating that the “shifting balance of risks may warrant policy adjustments.” The U.S. central bank leader unveiled a new policy framework comprising flexible inflation targeting that eliminates the ‘makeup’ strategy for inflation. This was widely expected but offered room for doves as Powell said, “Framework calls for a balanced approach when the central bank’s goals are in tension.” The policymaker cited downside risks to the labor market and the inflation risk due to the tariffs.
Following his remarks, the interest rate futures marked a 90% chance of a September Fed rate cut and two additional rate reductions by the end of 2025.
Elsewhere, recent Russian attacks on two Ukrainian villages and Kyiv’s drone strikes on Russian nuclear and power plants have dampened hopes for the fragile peace talks mediated by U.S. President Donald Trump.
Following that, U.S. President Donald Trump showed readiness to announce more sanctions on Russia. It should be noted that Trump earlier stated on Truth Social that Ukraine should have invaded Russia to avoid a full-scale war, fueling concerns about a lack of progress in upcoming talks between Ukrainian President Volodymyr Zelenskyy and Russian President Vladimir Putin. Adding to the uncertainty, BBC News quoted Russian Foreign Minister Sergei Lavrov saying Putin is willing to meet Zelenskyy “when the agenda is ready for a summit,” but claimed “this agenda is not ready at all,” accusing Zelenskyy of rejecting all proposals.
Furthermore, growing uncertainty about the U.S. security responsibility in the Ukraine conflict weighed on sentiment, as the White House pushes the European Union (EU) to take a major role.
Meanwhile, multiple news outlets conveyed a list of demands from Putin and heightened market fears ahead of the key talks. Important among them were no Donbas return, preventing Ukraine’s NATO membership, and no Western troops on Ukrainian soil.
On a different page, global rating agencies like S&P and Fitch kept their U.S. rating outlook unchanged last week, even as both these rating giants cited fears of deficit and slower growth.
Tuesday’s U.S. Durable Goods Orders and Consumer Confidence will precede Thursday’s revised readings of the second-quarter (Q2) Gross Domestic Product (GDP) to entertain the market players. More importantly, Friday’s U.S. Core PCE Price Index, the Fed’s preferred inflation gauge, will be crucial. As the Fed’s further rate cuts are data-dependent, apart from September’s, any wild variations could renew the U.S. Dollar buying and weigh on the cryptocurrencies.
Crypto Market News
The European Central Bank (ECB) is considering Ethereum and Solana platforms for a future digital Euro rollout, joining the league of major central banks preparing for the crypto race.
Wyoming made history as the first U.S. state to issue its own stablecoin — the Frontier Stable Token ($FRNT). The $FRNT was launched on seven blockchains with Visa support, and portrayed a more consumer-centered crypto move from the U.S.
Also important were statements praising the stablecoins from U.S. Treasury Secretary Scott Bessent, as he said that stablecoins hold the power to “unlock financial access for billions worldwide.”
U.S. Treasury Secretary Bassent advocated for more short-term Treasury bond issuance to support stablecoins, aligning with the GENIUS Act, which requires them to be supported by ultra-safe, liquid assets like Treasury bills (T-bills).
On the same line, Federal Reserve (Fed) Governor Michelle Bowman proposed allowing central bank staff to own small amounts of crypto products per the “De Minimis” criteria. Fed’s Bowman also discussed the need for Federal Reserve staff to gain a better understanding of cryptocurrencies.
Japan’s Financial Services Agency (FSA) braces for a yen-backed stablecoin later this year, per a Nikkei Asia report. The news states, “Japan’s FSA is mulling plans to allow a domestic fiat-pegged digital currency for the first time.”
Read Details: Japan’s First Yen-backed Stablecoin set for Approval, Issued by JPYC
The U.S. Department of Justice (DOJ) offered a sigh of relief to the developer community in the crypto universe, but it still targets the bad actors. That said, Acting Assistant Attorney General of the Criminal Division, Matthew R. Galeotti, spoke at the American Innovation Project Summit in Jackson, Wyoming, while unveiling some good news for the tech-wizards. “Our view is that merely writing code, without ill intent, is not a crime. Innovating new ways for the economy to store and transmit value and create wealth, without ill intent, is not a crime,” said the official.
Read Details: U.S. DOJ Eases Concerns for Developers, Pledges to Target Bad Actors in Crypto
Thailand’s Deputy PM Pichai Chunhavajira introduced TouristDigiPay, a unique program allowing visitors to convert crypto into baht at regulated exchanges. The move aims to attract Chinese tourists back after a 34% decline in arrivals this year.
Read more: Thailand Bets on Bitcoin: TouristDigiPay Lets Visitors Spend Crypto Like Cash
South Korea ordered crypto exchanges to suspend all lending services until new regulatory guidelines are in place. The Asian nation’s abrupt action kept the crypto traders on edge.
Bitcoin slips, but Gold, Equities Edge Higher
Bitcoin (BTC) price dropped for four of the last seven days, despite rising heavily on Friday, as market sentiment dwindled amid concerns about the U.S. Federal Reserve (Fed) and the trade/political pressure. Apart from the stellar jump on Friday and following retreat, a slew of on-chain signals and growing investor shift towards Ethereum also challenge Bitcoin bulls.
It should be noted, however, that the spot Gold (XAU) and the S&P 500 index turned green on the week after the latest rise, but the BTC remained negative. Let’s start discussing the key BTC moves and data to understand the crypto major’s action.
To begin with the correlation chart from TradingView, Bitcoin (BTC) reported the weekly loss, but the spot Gold (XAU) and the U.S. equity benchmark S&P 500 reported the week-on-week (WoW) gains, portraying a divergence in the investment pattern. This suggests the need for caution among the BTC traders as the Jackson Hole updates haven’t clearly ruled out the need for cautious among policymakers while deciding on the future rate moves.
The S&P 500 approached its ATH on Friday, even as it dropped for five consecutive days before, reporting 0.27% weekly gains to 6,466 at the latest.
Gold (XAU/USD) appeared somewhat firmer and ended the week on a positive note. That said, the bullion finished the week around $3,371, thanks largely to its jump on Friday, fueled by the market’s optimism and the U.S. Dollar’s slump after Powell’s speech.
BTC, S&P 500, and Gold

ETF Signals, On-Chain Developments Challenge BTC Bulls
Starting with the latest U.S. spot Exchange Traded Fund (ETF) data from the SoSoValue, the Bitcoin (BTC) spot ETFs recorded a six-day outflow pattern, before posting a minimal daily outflow of $23.15 million on Friday.
That said, the weekly total net outflow was $1.17 billion, snapping a two-week inflow pattern and reporting the biggest weekly outflow in six months.
With this, the monthly BTC ETF outflow figures for August snap the four-month uptrend with an outflow of $1.19 billion, the biggest since February, versus July’s $6.02 billion in inflows.
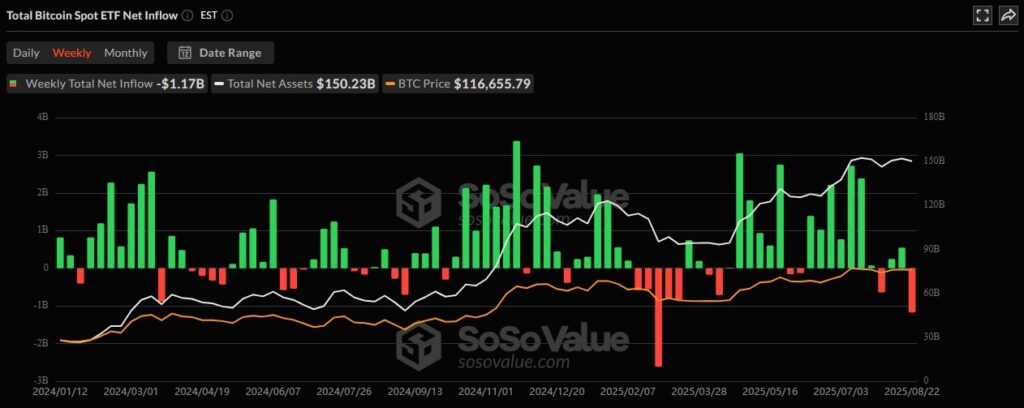
With this magnitude of surprise from the ETF flows on a monthly basis, a pullback in the BTC prices was justifiable. However, this doesn’t signal the start of a bearish Bitcoin trend unless the outflows continue in the coming sessions.
Bitcoin Whales, Total Funding Rates, and MVRV Ratio Eyed
Apart from the U.S. spot BTC ETF data, performance of the key wallets, upbeat total funding rates, and the Market Value to Realized Value (MVRV) metric portray warning signs for the Bitcoin buyers.
Bitcoin (BTC) MVRV Data, Total Funding Rates
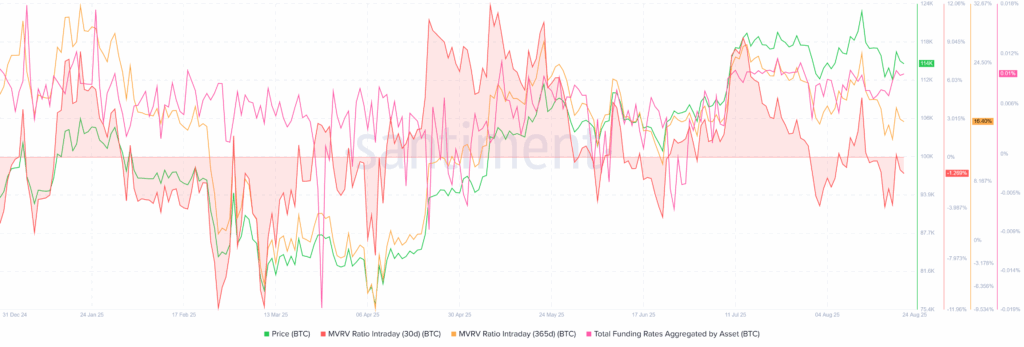
A combined metric showing Bitcoin’s Market Value to Realized Value (MVRV) and Total Funding Rates shows a cautiously optimistic picture.
That said, the MVRV (Market Value to Realized Value) ratio, which compares the current price to the average cost basis of holders, also known as the holder profitability, remains slightly risky on a long-term basis ( over 16.7% on a 365-day basis), while staying downbeat in the short-term (-1.3% on 30-day). This doesn’t exactly portray the overheated market conditions for BTC, even if a slight caution is needed, considering the long-term MVRV.
Elsewhere, the Total Funding Rates Aggregated by BTC, a recurring fee that long positions pay to short positions, or vice versa, at predetermined intervals (usually every 8 hours), per Santiment. With gradually increasing funding rates, the metric suggests that traders are increasingly betting on higher prices. That said, the cost index rose 24.88% during the August 18 to 24 period, currently around 0.009566%.
Bitcoin (BTC) Daily Active Addresses, Transaction Volume
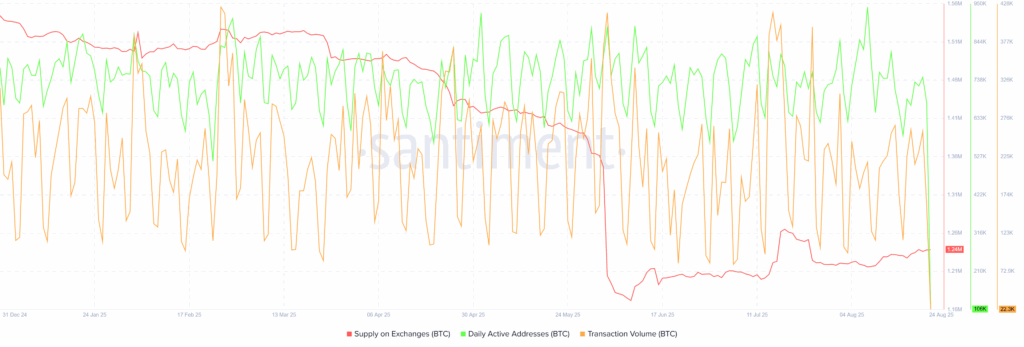
Meanwhile, the Daily Active Addresses and Transaction Volume metrics for BTC show less participation from the crypto traders. However, the main concern is Bitcoin’s rising Supply on Exchanges, suggesting a steady increase in the total amount of BTC located in known exchange wallets since early June.
That said, the Daily Active Addresses and Transaction Volume dropped around 9.0% and 25.0% to 680K and 160K since June 09. Notably, the Supply on Exchanges rose 5.65% or 67K coins during the stated period. In this regard, Santiment states, “This is a notable shift from the long-term trend of coins moving into cold storage and can indicate that more holders are positioning themselves to sell,” which in turn justifies the latest weakness in the BTC price despite firmer ETH.
Bitcoin Supply Distribution for August 18-24
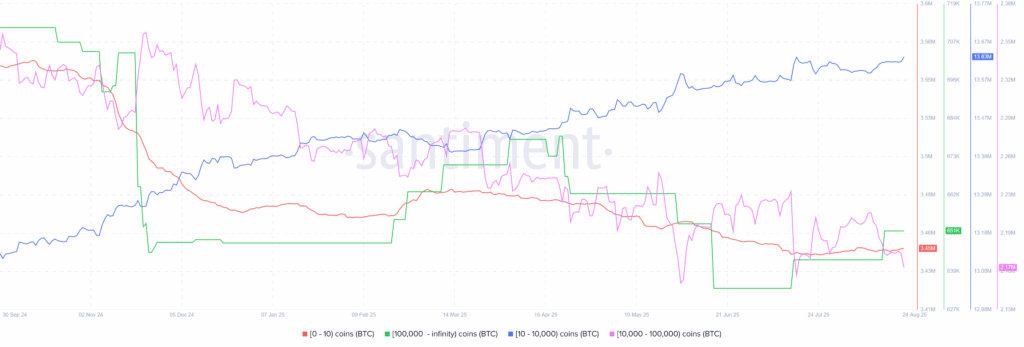
As per the Santiment data for August 18-24, the wallets (addresses) holding 10–10,000 BTC, known as sharks, increased their holdings by 223.0 BTC, marking almost a 0.0% accumulation.
On the other hand, the retail wallets (holding 0–10 BTC) added 1,180 BTC (or +0.03% addition), while the whales (wallets with 10,000–100,000 BTC) also increased their holdings by 960.00 BTC, or 0.04%.
Meanwhile, the mega-wallets, wallets with over 100,000 BTC holdings, reported no change in their holdings during the stated period, currently around 651K BTC.
Hence, there was an overall lack of trader participation in the BTC during the last week, raising fears about the quote’s further upside.
Technical Analysis Challenges BTC Bears
As per the BTC’s daily chart, the Directional Movement Index (DMI) and Moving Average Convergence Divergence (MACD) indicate continued short-term downside pressure, putting key technical support levels to the test.
Bitcoin Price: Daily Chart Suggests Further Upside
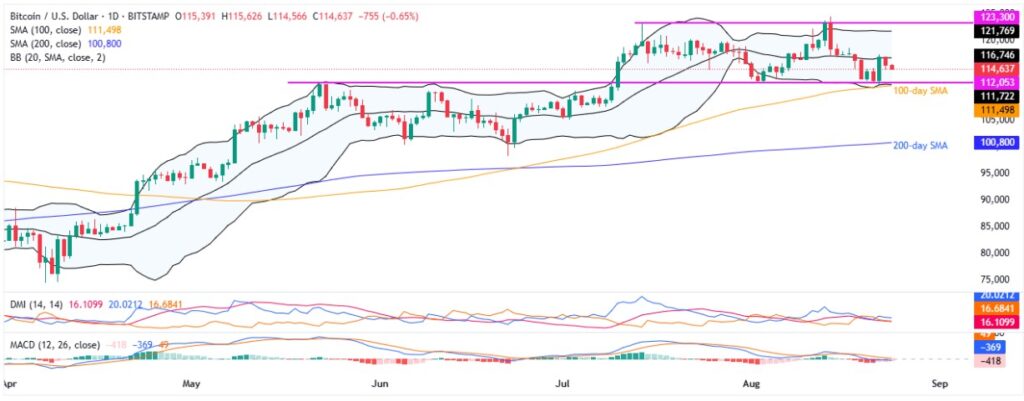
Bitcoin’s recovery from a three-month horizontal support has little support from the DMI and MACD, suggesting challenges to the $112K key support.
However, a convergence of the lower Bollinger Band (BB) and the 100-day Simple Moving Average (SMA), close to $111K, could act as the last line of defense of BTC buyers.
MACD flashes bearish (red) signals, favoring the crypto major’s two-week downside. Meanwhile, the DMI’s Downmove line (D–, orange) remains below the 25.00 threshold, indicating weak bearish momentum, and stays below the Upmove line (D+, blue), but above the Average Directional Index (ADX, red), suggesting that buying momentum is absent.
In a case where the quote breaks the $111,700 and the $111,500 key support levels, comprising the lower BB and the 100-day SMA, June’s peak of $110,500 and early-July swing low around $105K might test the BTC bears. Still, the all-important 200-day SMA support of $100,800 holds the key to turning the broad bullish trend towards a bearish one.
Alternatively, Bitcoin’s fresh recovery could aim for the middle BB surrounding $116,800 before facing the $120K psychological magnet.
Beyond that, the upper BB and a five-week-old horizontal resistance, respectively near $121,800 and $123,300, quickly followed by the all-time high near $124,500, will act as the last line of defense of sellers.
Overall, Bitcoin’s (BTC) technical analysis suggests continued near-term weakness. However, a slew of untouched strong support levels and a lack of bearish momentum on the daily chart continue to protect BTC’s broader bullish trend.
Ethereum Pullback Again Delayed
Even if the on-chain data flashes mixed signals, Ethereum’s (ETH) much-awaited pullback is again delayed as it hit the ATH, contrary to the BTC and the XRP weakness.
ETH ETFs Post Needed Consolidation
As per the latest SoSoValue data, the U.S. Ethereum (ETH) spot ETFs dropped for four consecutive days before posting an inflow on Friday. With this, the weekly ETH ETF outflows are staggering to raise eyebrows.

On August 21, the U.S. Spot ETH ETFs reported its first daily inflow in five, with a strong $287.61 million figure.
Still, the weekly ETH ETF flows snapped a 14-week inflow pattern, withthe weekly outflow totalling $578.89 million, to print the record weekly outflow and raise fears of the market’s consolidation if fundamentals shift. Meanwhile, July saw a record-breaking $5.43 billion in the U.S. spot ETH ETF inflows, extending its four-month uptrend, whereas August saw $2.45 billion of total inflows so far.
Ethereum On-Chain Data Flashes Mixed Signals
In the case of Ethereum, the supply distribution data signals accumulation by the important wallets and favor bulls, but other on-chain signals are mixed and challenge the optimists.
Ethereum Supply Distribution for August 18-24
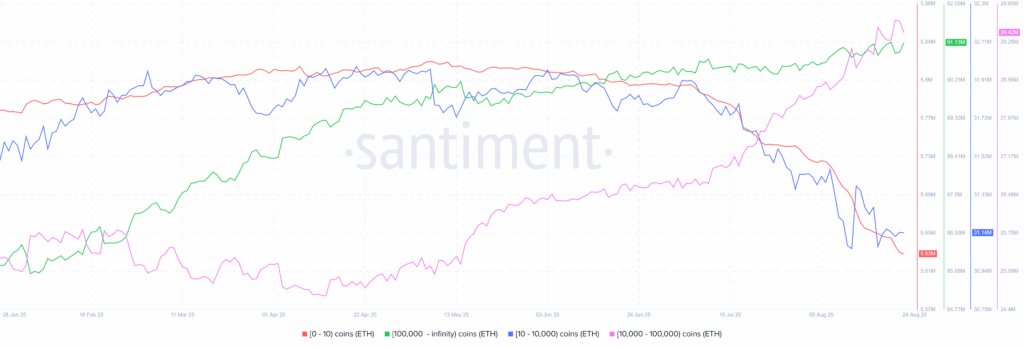
As per the Santiment data for August 18-24, the wallets (addresses) holding 10–10,000 ETH, known as sharks, increased their holdings by 60,800 ETH, marking almost a 0.2% accumulation.
On the other hand, the retail wallets (holding 0–10 ETH) cut their holdings by 19.500 ETH (or -0.35%), while the whales (wallets with 10,000–100,000 ETH) also reduced their holdings by 68,400, or –0.23%.
Meanwhile, the mega-wallets, wallets with over 100,000 ETH holdings, reported a notable increase in their holdings, by 272K or 0.3% during the stated period, currently around 91.1 million ETH.
Hence, sharks and mega-wallets are both accumulating the ETH, even if the retail and whales are trimming the holdings, which in turn suggests a healthy buying pattern for the second-largest crypto and favor the latest run-up in the Ethereum prices to the record high.
Furthermore, the MVRV ratio flashes warnings while the total funding rates are positive, but the Mean Dollar Invested Age (MDIA) is dropping sharply. A fall in the MDIA suggests that long-dormant coins are re-entering the circulation channel via exchanges, a generally bullish sign for the coin. Additionally, Network Realized Profits are strong, and the Supply on Exchanges continues to fall, suggesting a strong preference for holding the coin, another bullish sign.
Ethereum (ETH) MVRV Data, Total Funding Rates
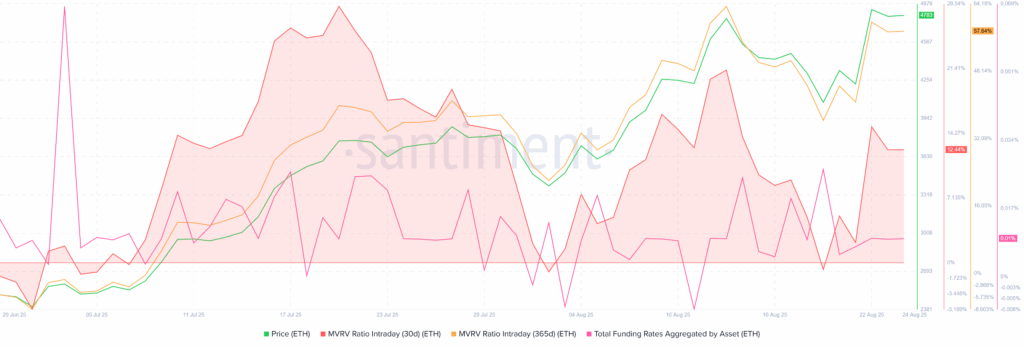
In case of the Etehreum, MVRV metric appears more alarming as long-term holders’ profitability jumped (over 57.5% on 365-day MVRV) while the short-term holders (30-day MVRV) also cheered around 12.40% profitability. Both these levels are close to the alleged “danger zone” where altcoins often experience pullbacks.
It should be noted that the total funding rates grew 2.9% during the August 18 to 24 period, currently around 0.009478%. This shows the traders’ readiness to pay a higher premium to defend the position, long positions in this case, which in turn suggests increased bullish bias among the traders.
Ethereum (ETH) MDIA, Supply on Exchanges, Network Realized Profits
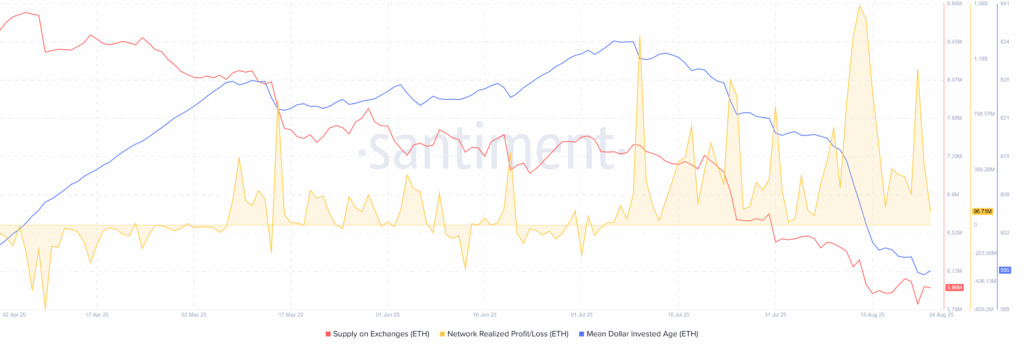
On a different page, Mean Dollar Invested Age, whichtracks the average age of invested capital, dropped nearly 6.0% since early July, near to the lowest levels in five months surrounding 595 by the press time. On the same line, Supply on Exchanges slumped 19% to 5.96 million. Furthermore, Network Realized Profits rallied 310% to 434.66 million during the aid period from early July.
These catalysts together suggests a healthy run-up in prices with a slight need for cautious as the Fed’s next move still depends on the data, even if the September rate cut and two more reductions are widely discussed.
ETH/BTC Chart Pokes Ethereum Bulls
While the on-chain signals are mixed and the ETF outflows raised worries, the ETH/BTC ratio also faces the key upside hurdle, namely the 100-week SMA. It’s worth noting, however, that the quote’s sustained breakout of a 23-month resistance line keeps the buyers hopeful.
ETH/BTC Ratio: Weekly Chart
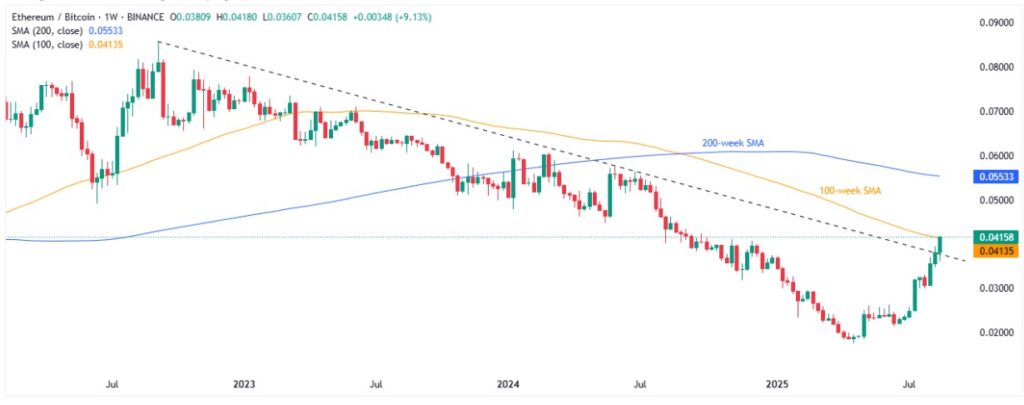
ETH/BTC ratio needs successful trading beyond the 100-week SMA of 0.04135 to keep buyers on board.
However, the 14-Week Relative Strength Index (RSI) is deep into the overbought territory past the 70.00 threshold, suggesting a pullback in prices.
This highlights the multi-month previous resistance line, close to $0.0370 at the latest, as the decisive level, a downside break of which could trigger the much-awaited pullback in the prices.
Alternatively, an upside clearance of the 0.04135 hurdle comprising the 100-week SMA will open the door for the ETH/BTC ratio’s rally toward the 200-week SMA hurdle of 0.05533 before the yearly high of 0.06117.
Ethereum Technical Analysis Signals Consolidation
Ethereum’s technical analysis suggests a trend-widening formation and continuation of two-month upside. However, the overbought Stochastic indicator could join the “rising mehapgone” pattern to offer intermediate pullbacks in the ETH prices.
Ethereum Price: Daily Chart Points To Short-term Pullback
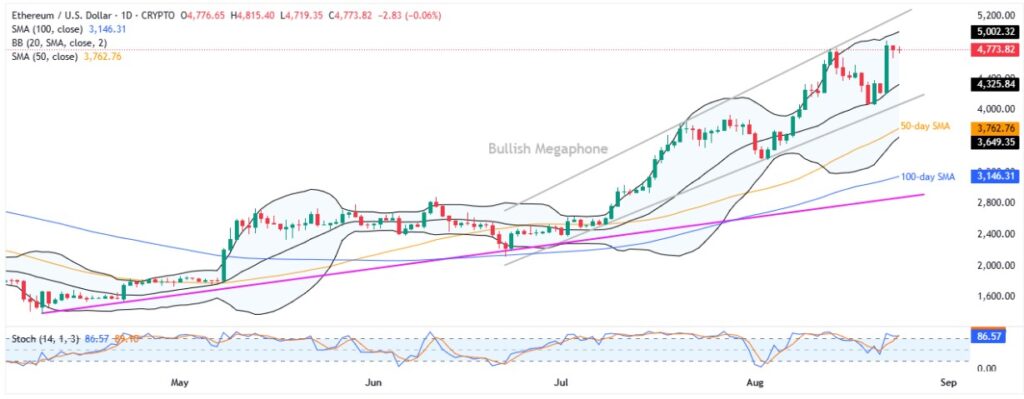
Despite refreshing the all-time high (ATH), Ethereum stays within a Bollinger Band (BB), suggesting a safe distance from the overheated signal. However, the Stochastic indicator is well beyond the 80.00 overbought limit and hence points to a short-term pullback in the ETH price.
This highlights the middle BB of $4,325 as a short-term key support before the bottom of a six-week bullish megaphone around $4,080.
Should Ethereum’s weakness continue below $4,080, further downside toward the 50-day SMA level of $3,762 and then to the lower BB of $3,650 becomes imminent. However, the 100-day SMA and an upward-sloping trendline from early April, close to $3,145 and $2,880 in that order, serve as the final line of defense for the bulls before bears take control.
Alternatively, a breakout above the upper BB of near $5,001 could target the stated megaphone’s top around $5,210.
Overall, the ETH’s pullback appears overdue, but the broad bullish trend remains intact.
Ripple Remains Pressured
Ripple (XRP) dropped nearly 2.0% last week and fell short of tracing the up-moves in Bitcoin.
The XRP’s latest pullback could be linked to a likely profit-booking by the long-term buyers, as per the MVRV (Market Value to Realized Value) ratio. However, the whale buying has also been sluggish and suggests a likely continuation of pullback in the prices.
The MVRV (Market Value to Realized Value) ratio from Santiment, which compares the current price to the average cost basis of holders, spiked to risky levels when the XRP hit a record high, resulting in the following pullback.
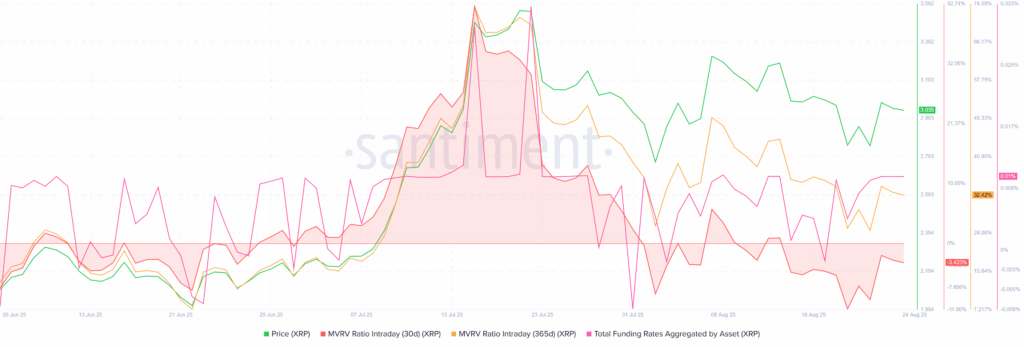
At its top, the XRP’s 365-day MVRV surged above +70% in July before retreating to 33% at the latest, showing most holders are deep in profits despite the retreat. Such elevated MVRV levels often signal that many investors may start taking profits, increasing the risk of a pullback in prices, which ultimately could be witnessed in Ripple’s performance after it hit the all-time high (ATH). In short, the rally pushed XRP into overvalued territory, and then the consolidation happened. It should be noted that the 30-day MVRV turned negative before improving in the last week from -11.68% to -3.42% at the latest, which in turn suggests a potential pullback for the short-term.
Elsewhere, wallets holding 1 million or more XRP, known as whales, hit a record high of 2,749 earlier in July but retreated to 2,675 by the end of August 24, with these wallets collectively holding roughly $47.44 billion in XRP, down a bit from $47.46 billion marked on August 18. With this, Ripple buyers show a little confidence despite the resolution of its multi-year battle with the U.S. Securities and Exchange Commission (SEC).
XRP 1M+ Coin Balance By Number & Total Balance Held
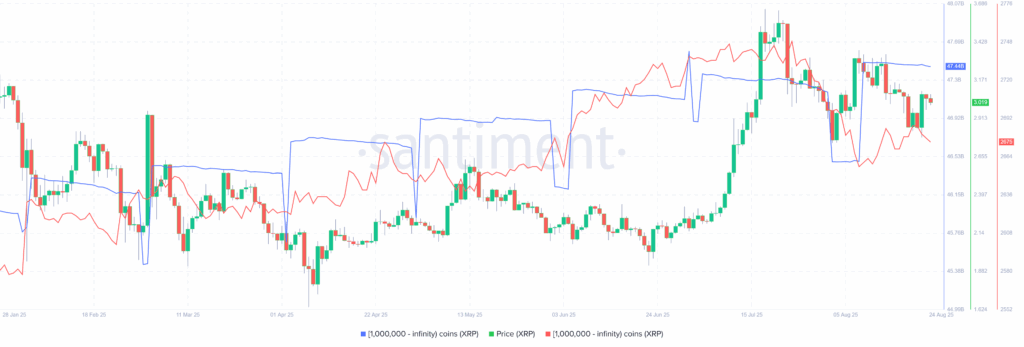
To sum up, the XRP’s MVRV Ratio and wallet performance portray price consolidation. The latest cooling off appears a healthy correction after overheated gains. That said, without strong bullish fundamentals, which seem unlikely for now, the sluggish trend may continue.
Ripple Technical Analysis Suggests Short-Term Consolidation
From a technical standpoint, XRP stays between a seven-month-old broad horizontal resistance zone, surrounding $3.33-$3.36, and the lower BB, close to $2.83. The consolidation bias also takes clues from the steady 14-day Relative Strength Index (RSI) line and bearish signals from the Moving Average Convergence Divergence (MACD).
Ripple Price: Daily Chart Signals Range-Bound Trading
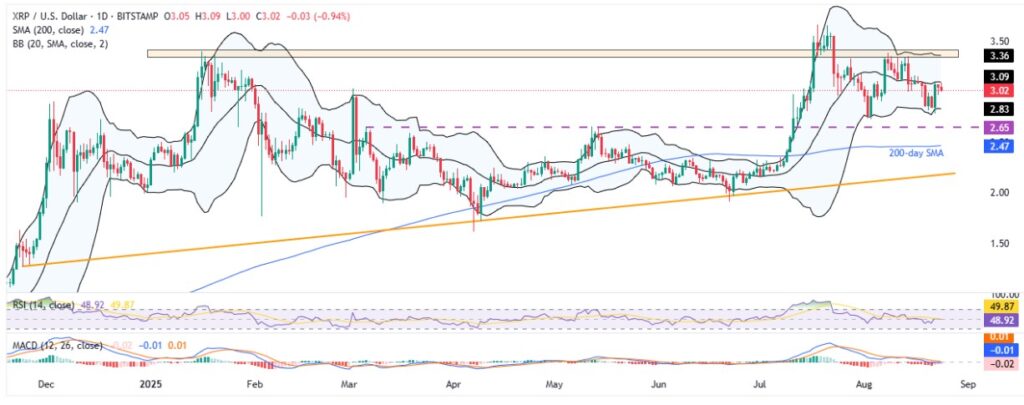
With the quote’s latest pullback from the middle BB, the XRP is likely to face a decline toward the lower BB line surrounding $2.83.
However, Ripple’s further downside is likely to be restricted from a horizontal line from March, close to $2.65, if not, then the 200-day SMA and an ascending trend-line from April, near $2.47 and $2.17 respectively, will be the last line of defense for the bulls.
Alternatively, an upside clearance of the middle BB of $3.09 will highlight the multi-month horizontal resistance area comprising the upper BB, between $3.33 and $3.36. A decisive break of which could propel price toward the all-time high (ATH) marked in July near $3.67 and then to the $4.00 psychological magnet.
Conclusion
Having witnessed a wild ride the last week, the cryptocurrency traders are expected to face a somewhat shallow week, but not totally dormant, which can give rise to consolidation of the latest crypto moves.
On-chain data and ETF flows show mixed signals for BTC and ETH. Bitcoin’s whale activity remains cautious, while ETF outflows and rising supply on exchanges raise red flags.
ETH, on the other hand, benefits from institutional interest and strong wallet accumulation, but its overheated profitability metrics hint at a potential short-term pullback.
For XRP, fading whale confidence and elevated long-term holder profits indicate continued price consolidation, with no strong bullish fundamentals in sight.
Moving on, Friday’s Core PCE Price Index will be the key to watch, apart from the intermediate jitters due to Tuesday’s Durable Goods Orders, Thursday’s Q2 GDP, and the trade and political news.
Even if a September Fed rate cut is almost given, the Fed’s future policy moves remain data-dependent. Hence, any surprise in inflation or growth data could raise doubts about the U.S. central bank’s rate cuts past September and trigger fresh U.S. Dollar strength, potentially pressuring crypto again.


